KWEB 27-day bullish forecast — Nov 8, 2026
- Bias: Bullish
- Timeframe: 27 days (made Nov 8, 2026, target date Dec 4, 2026)
- Price at analysis: $24.88
- Price target: $25.80
- Expected range: $23.40 – $27.10
- Result: Pending — graded after the close on Dec 4, 2026
Get a free AI analysis of KWEB today
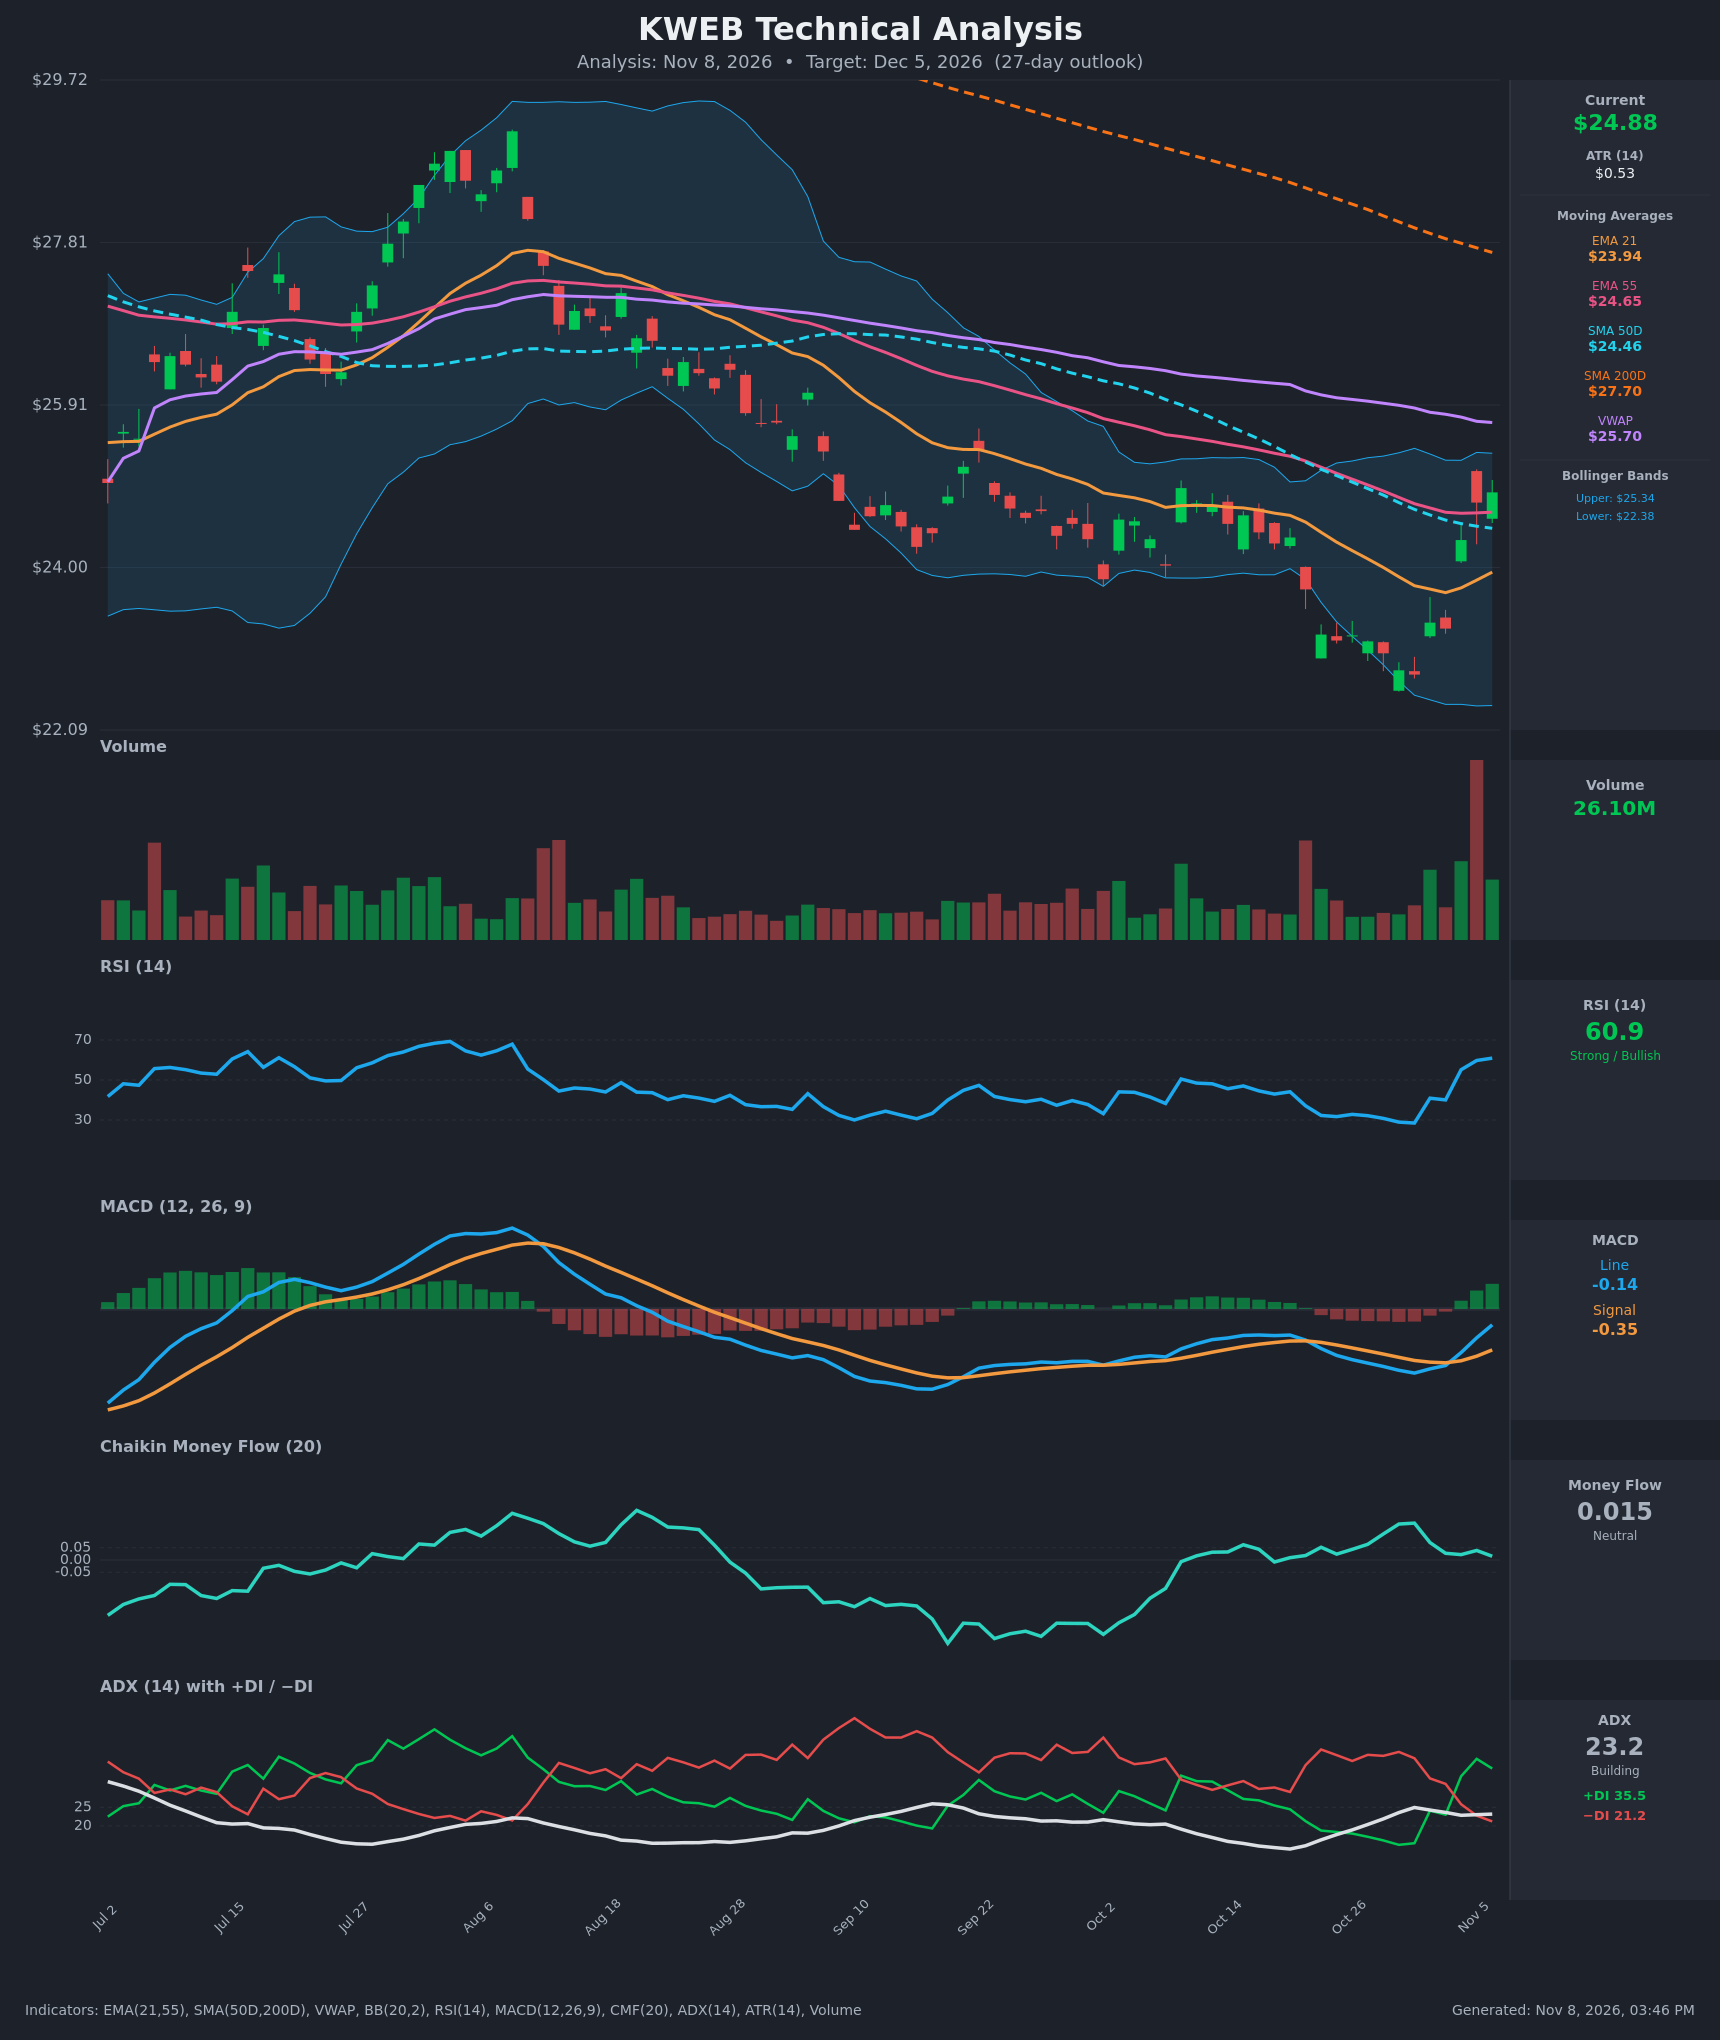
Analysis
TECHNICAL INDICATORS
- RSI (14): 60.93, up sharply from 28.5 on Oct 30 and now near the top of its neutral-to-bullish zone. Momentum is clearly rising, with room before the 70 overbought line. [Bullish]
- 20 EMA: The 21 EMA is at $23.94, and price at $24.88 is about 3.9% above it, so it now acts as support. Price has also reclaimed the 55 EMA ($24.65) and the SMA50D ($24.46). VWAP ($25.70) and SMA200D ($27.70) are still overhead. [Bullish]
- MACD: Line -0.136 vs signal -0.351, giving a positive histogram of about +0.21. The bullish crossover came on Nov 4 and the gap is widening. Both lines are still below zero, so this is an early recovery, not a confirmed trend change. [Bullish]
- Bollinger Bands (20): Upper $25.34, lower $22.38. Price bounced off the lower band (the Oct 30 low was $22.74) and is now in the upper half, about $0.46 below the upper band. The wide bands show elevated volatility. A walk along the upper band would be bullish, but the upper band and VWAP are near-term hurdles. [Bullish]
- CMF (20): 0.015, inside the ±0.05 neutral band. It has faded from about 0.15 at the Oct 30 low, so the bounce is not yet backed by sustained accumulation. [Neutral]
- ADX (14): 23.2, rising modestly, with +DI 35.5 above −DI 21.2. The bullish DI crossover happened on Nov 3-4, when −DI had dominated for weeks. ADX is below 25, so trend strength is not confirmed yet, but control has flipped to the bulls. [Weak-to-Building Trend, Bullish direction]
- Volume: 26.10M on the latest bar, the largest in the visible window. The reversal bar on Nov 4 came on a heavy volume spike, which looks like capitulation or a washout followed by follow-through buying. [Bullish – high-volume reversal]
DIVERGENCES & TRENDS
- RSI made a higher low (about 28.5) against the price low, and RSI and MACD have turned up together. This is a mild bullish momentum shift, not a classic divergence.
- The MACD histogram has flipped from negative to positive after a month of bearish momentum.
- EMA21 ($23.94) is still below EMA55 ($24.65), so the medium-term EMA structure is bearish. The gap is narrowing, and a cross would need about $0.7 more of EMA21 advance.
- SMA50D ($24.46) is far below SMA200D ($27.70), so the death-cross structure remains intact. Price is about 10% below SMA200D, so the long-term trend is still down.
- Price has reclaimed the SMA50D, EMA55 and EMA21 within three sessions, which is a short-term trend improvement.
- −DI → +DI crossover with a volume spike confirms the shift in control. CMF is the lagging confirmation.
CHART PATTERNS
- Bullish Falling Wedge / descending channel breakout: From the August high, price fell in a descending channel of lower highs and lower lows. It then broke sharply higher out of the channel with a volume spike. The measured target is a retrace toward the wedge's start, around $25.9-$27, but that is only partly achievable within 27 days.
- Bullish Double Bottom (loose): Lows near $22.99 on Oct 28 and $22.74 on Oct 30 form a rounded double-bottom area. The neckline is near $25.3-$25.9, which is also the upper Bollinger Band and VWAP. A close above $25.9 would confirm it, with a measured move toward about $27.
- Caveat: The pattern is within a larger downtrend, below the SMA200D and its death cross. Rallies could stall at VWAP ($25.70) and the $26 gap area, which would make it a counter-trend bounce.
POTENTIAL SCENARIOS
- Scenario 1: Bullish Reversal Follow-Through — Price holds above the EMA55/SMA50 cluster and pushes through the upper Bollinger Band and VWAP, completing the double-bottom/falling-wedge breakout. Trigger: a daily close above $25.70, with the MACD histogram expanding and ADX above 25. Target: $25.80 to $27.00. Invalidation: a daily close below $24.40 (SMA50D). (50% probability)
- Scenario 2: Bearish Failed Bounce — The rally stalls at VWAP/the upper band, CMF stays flat and the bounce is sold as a lower high inside the larger downtrend. Trigger: rejection at $25.30-$25.70 and a close below $24.46. Target: $23.40 to $23.90 (EMA21 and the retest of the lows). Invalidation: a close above $25.90. (35% probability)
- Scenario 3: Neutral Consolidation — Price digests the sharp bounce between the EMA21 and VWAP. Trigger: low volume and narrowing daily ranges. Target: $24.20 to $25.50. Invalidation: a close outside $23.90-$25.70. (15% probability)
PRICE TARGETS
27-day timeframe. The range width is $27.10 − $23.40 = $3.70, or about 14.9% of the $24.88 price, which fits the 12-18% guidance for 30-60 days and a bit less for 27 days. The target is +3.7% above the current price, about 2.1 ATRs.
- Target Price: $25.80
- Expected Range: $23.40 to $27.10
- Key Levels: Support at $24.46 (SMA50D; EMA55 at $24.65 is just above it, and EMA21 at $23.94 is deeper support), Resistance at $25.70 (VWAP, with the upper Bollinger Band at $25.34 just below)
OVERALL BIAS
OVERALL BIAS: BULLISH - A high-volume reversal off the lower Bollinger Band, with a MACD bullish crossover, a +DI/−DI flip and rising RSI. Price has reclaimed the EMA21, EMA55 and SMA50D. Conviction is modest because CMF is neutral, ADX is below 25 and price is still below VWAP and the SMA200D.
This is educational analysis and not financial advice.