QQQ 27-day bearish forecast — Nov 8, 2026
- Bias: Bearish
- Timeframe: 27 days (made Nov 8, 2026, target date Dec 4, 2026)
- Price at analysis: $656.10
- Price target: $638.00
- Expected range: $598.00 – $682.00
- Result: Pending — graded after the close on Dec 4, 2026
Get a free AI analysis of QQQ today
Analysis
TECHNICAL INDICATORS
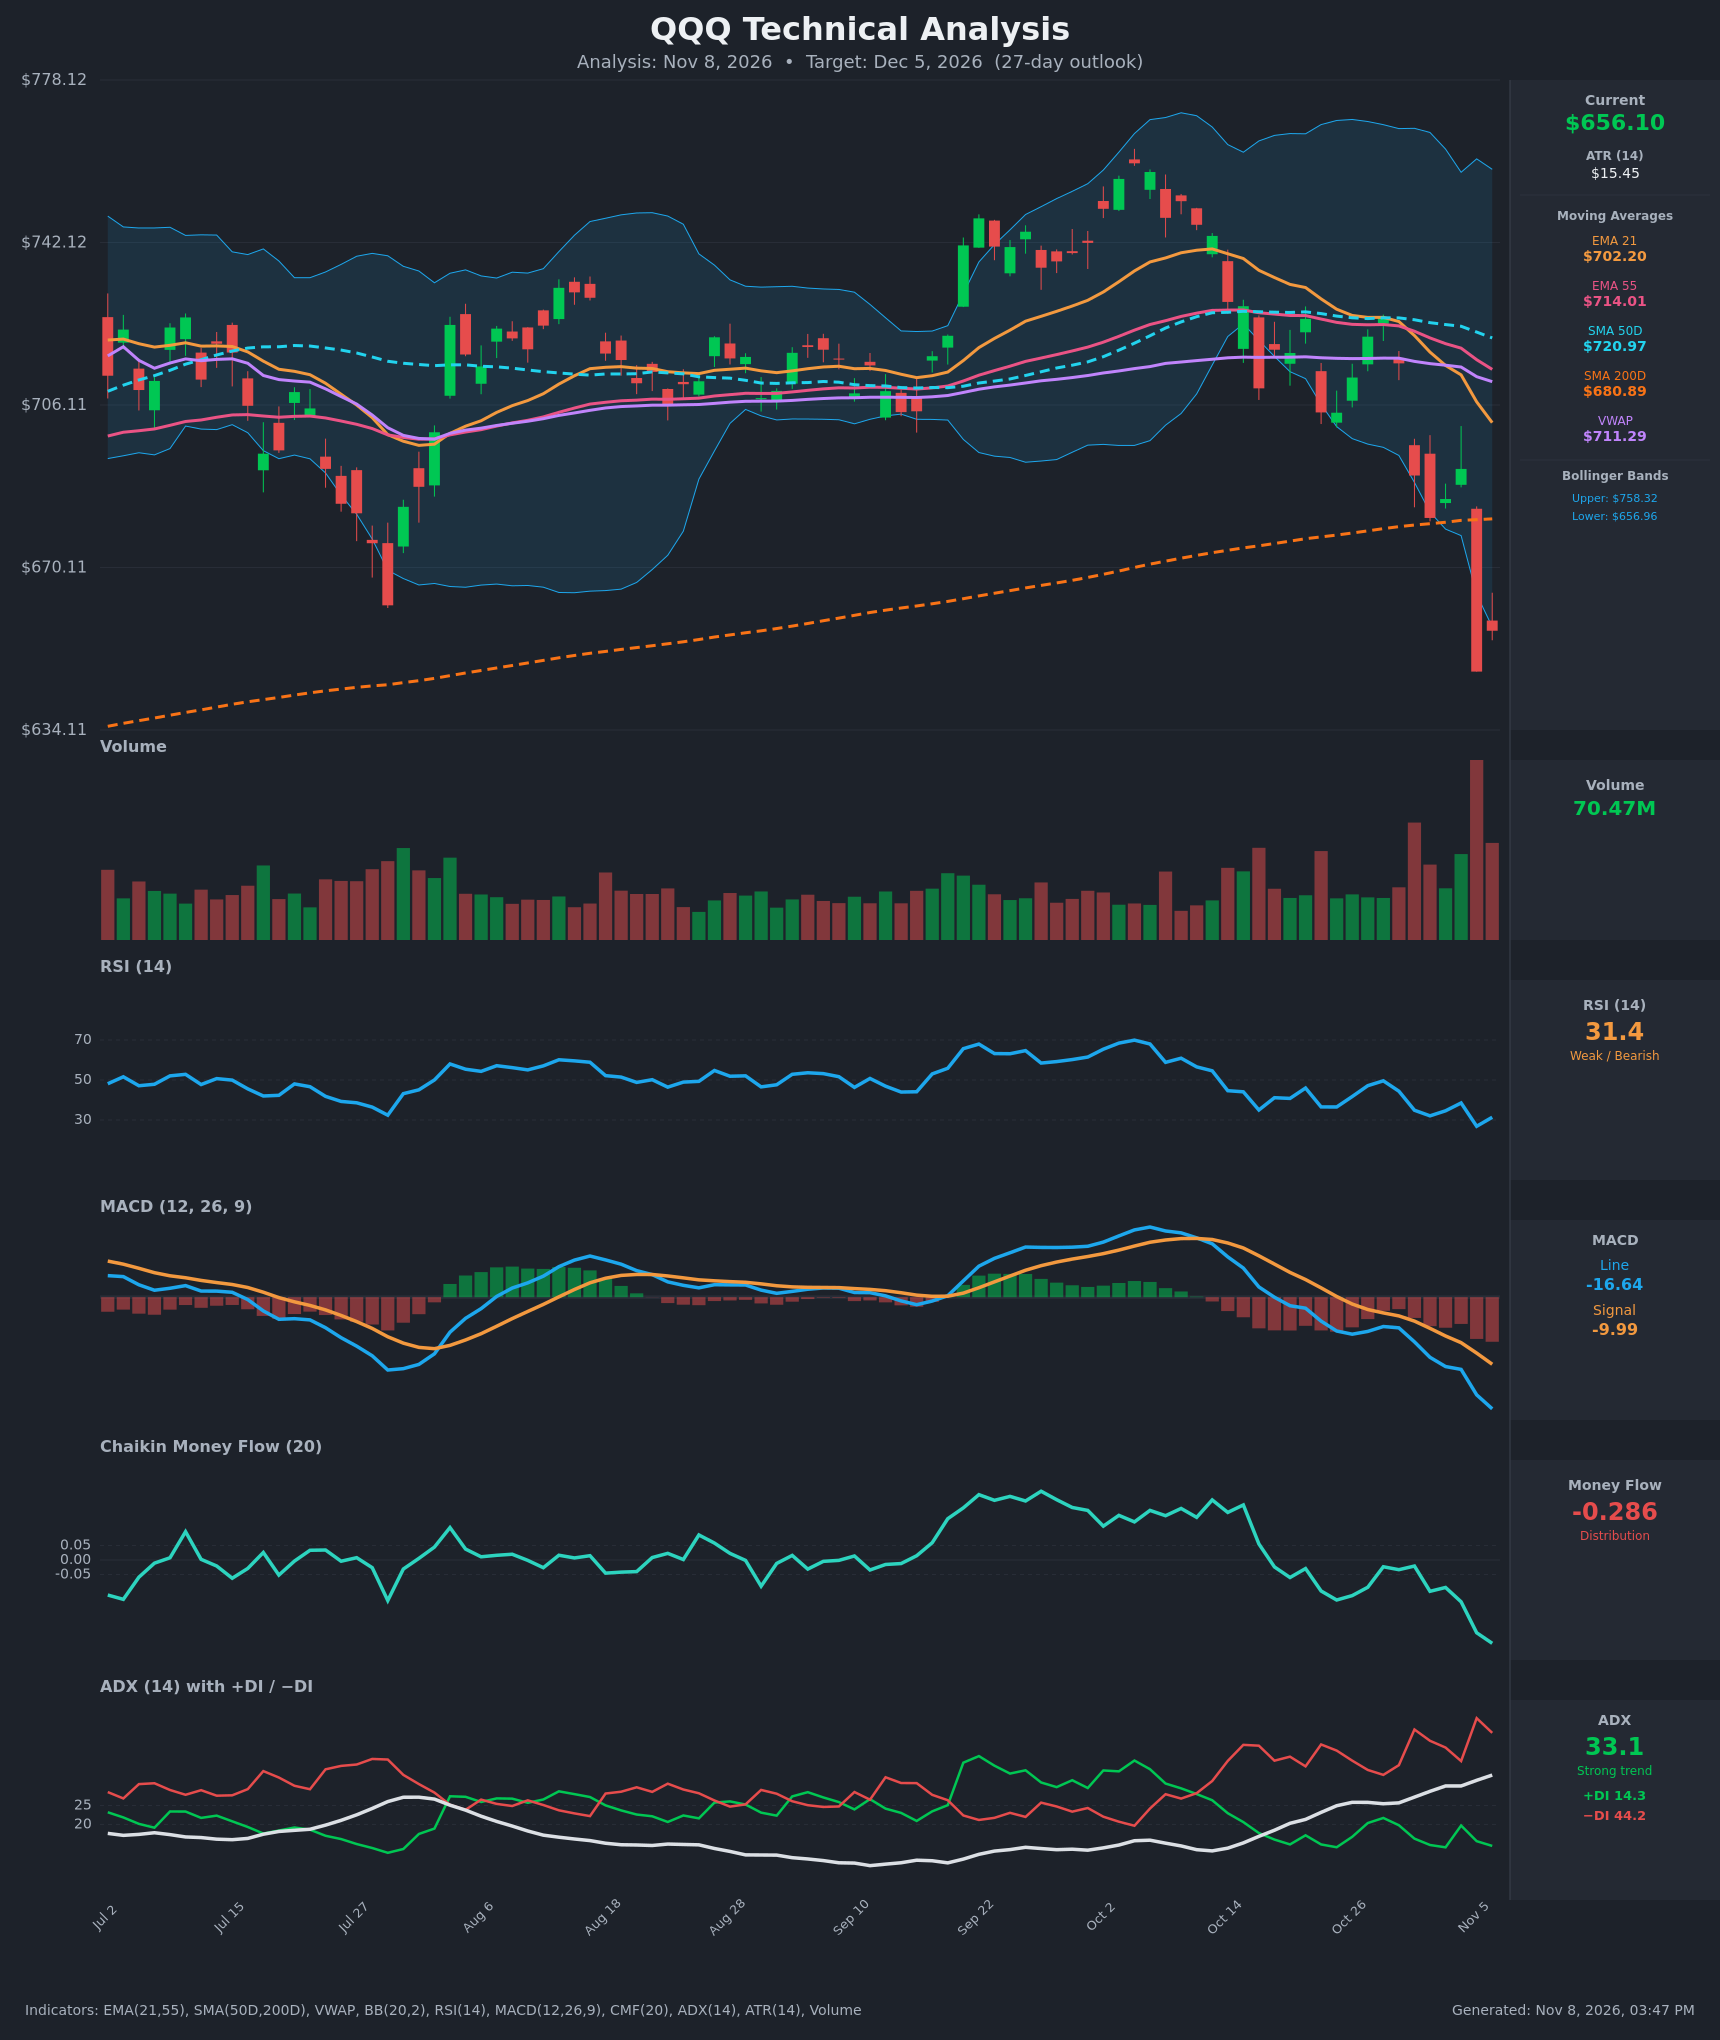
- RSI (14): 31.37, just recovering from 26.9 on Nov 5 (oversold). It is near oversold but has not yet formed a higher low or any bullish divergence. Momentum remains weak, and a bounce is possible, but this is not yet a reversal signal. [Bearish]
- 20 EMA: The 21 EMA is $702.20 and the 55 EMA is $714.01. Price at $656.10 is about 6.5% below the 21 EMA, and both EMAs are sloping down. The 21 EMA is converging on the 55 EMA and is about to cross below it (a bearish EMA crossover). Both act as overhead resistance. [Bearish]
- MACD: The line (-16.64) is below the signal (-9.99) with a widening negative histogram. The bearish crossover occurred around Oct 26 and has since accelerated, and the line is making new lows, so there is no momentum divergence. [Bearish]
- Bollinger Bands (20): The lower band is $656.96, the upper band is $758.32, and the midline is about $707. Price is at or just below the lower band after a wide, expanding-band selloff. A band walk lower in a strong trend is typically continuation, though a mean-reversion bounce toward the midline (~$707) is the counter-risk. [Bearish]
- CMF (20): -0.286, falling steadily from the +0.2 area in early October. This is a heavy and accelerating distribution reading, well below the -0.05 threshold. [Distribution]
- ADX (14): 33.1 and rising, with −DI (44.2) far above +DI (14.3). This is a strong, established downtrend with bears firmly in control. [Strong Trend – Bearish]
- Volume: 70.47M on Nov 6, following a very large spike on the Nov 5 breakdown candle (-6.5%). The highest-volume bar of the period came on a red candle, showing heavy selling pressure. It could be a capitulation, but the follow-through bounce on Nov 6 was modest. [Bearish – Heavy Selling]
Other trend context:
- Price has fallen below the SMA200D ($680.89), which has been support since the summer, and this loss of long-term support is a notable negative.
- The SMA50D ($720.97) is still above the SMA200D, so there is no death cross yet, but the 50D is rolling over.
- Price is also well below VWAP ($711.29).
DIVERGENCES & TRENDS
- There is no bullish divergence. RSI made a lower low on Nov 5 in line with price, MACD is at its lowest level of the period, and CMF is at its lowest level of the period. Momentum and money flow confirm the price decline.
- The RSI bounce from 26.9 to 31.4 is only a small relief move.
- Crossovers and breaks:
- MACD crossed bearish on Oct 26.
- −DI has dominated +DI for the whole period.
- Price broke below the 21 EMA, 55 EMA, 50D SMA, VWAP and now the 200D SMA.
- The 21 EMA is about to cross under the 55 EMA.
- ADX is trending higher, from the low 20s to 33, and confirms that the trend is strengthening.
- Bearish stack: every moving average sits above price, and the 200D SMA is the nearest at about +3.8% away.
CHART PATTERNS
- The chart shows a Bearish Triple Top / Rectangle-style distribution from August to October. Price failed repeatedly at about $735–$750 and has now broken down through the $700–$715 base (the "neckline" zone).
- The measured move from that range (about $45 high to low) projects to roughly $655, which has already been reached. A further extension toward $620–$640 would require a sustained break below the Nov 5 low.
- The Nov 5 capitulation candle also resembles a breakdown gap. Any rebound toward $680–$700 would be a retest of broken support (the SMA200D, then the 21 EMA), which fits a bearish pullback-and-fail structure.
- There is no confirmed bullish reversal pattern (no double bottom or inverted head and shoulders), so the bearish read is stronger.
POTENTIAL SCENARIOS
- Scenario 1: Bearish Trend Continuation — The strong downtrend (ADX 33, −DI 44) and heavy distribution (CMF -0.29) persist. Price retests broken support near $680 (the SMA200D), fails, and grinds lower. Trigger: a daily close below the Nov 5 close of $647. Target: $625–$640 (about 1.5 ATR-based extension). Invalidation: a daily close above $682 (the SMA200D). (50% probability)
- Scenario 2: Bullish Oversold Relief Bounce — RSI near 30, price at the lower Bollinger Band and a capitulation-volume spike lead to a mean-reversion rally toward the 21 EMA/midline. Trigger: a reclaim of $681, then of $690. Target: $700–$710. Invalidation: a close below $647. (33% probability)
- Scenario 3: Neutral Choppy Base — Price consolidates after the capitulation, between about $640 and $685, as the selling exhausts. Trigger: a series of inside days with falling volume. Target: about $655–$665. Invalidation: a close outside $640–$685. (17% probability)
PRICE TARGETS
- Target Price: $638.00 (27-day)
- Expected Range: $598.00 to $682.00 (width $84 ≈ 12.8% of current price, consistent with a 27-day horizon)
- Key Levels: Support at $647.05 (Nov 5 close), then about $634; Resistance at $680.89 (the SMA200D), then $702.20 (21 EMA)
OVERALL BIAS
OVERALL BIAS: BEARISH - Price is below every major moving average and the 200D SMA, with a strongly trending ADX (33, −DI dominant), a widening MACD bearish gap and deep CMF distribution. The oversold RSI raises the odds of a relief bounce, but it shows no divergence or reversal pattern, so continuation is more likely and any rally into $680–$700 is more likely to be sold.
This is educational analysis and not financial advice.