SMCI 27-day bearish forecast — Nov 8, 2026
- Bias: Bearish
- Timeframe: 27 days (made Nov 8, 2026, target date Dec 4, 2026)
- Price at analysis: $28.76
- Price target: $26.50
- Expected range: $23.50 – $31.00
- Result: Pending — graded after the close on Dec 4, 2026
Get a free AI analysis of SMCI today
Analysis
TECHNICAL INDICATORS
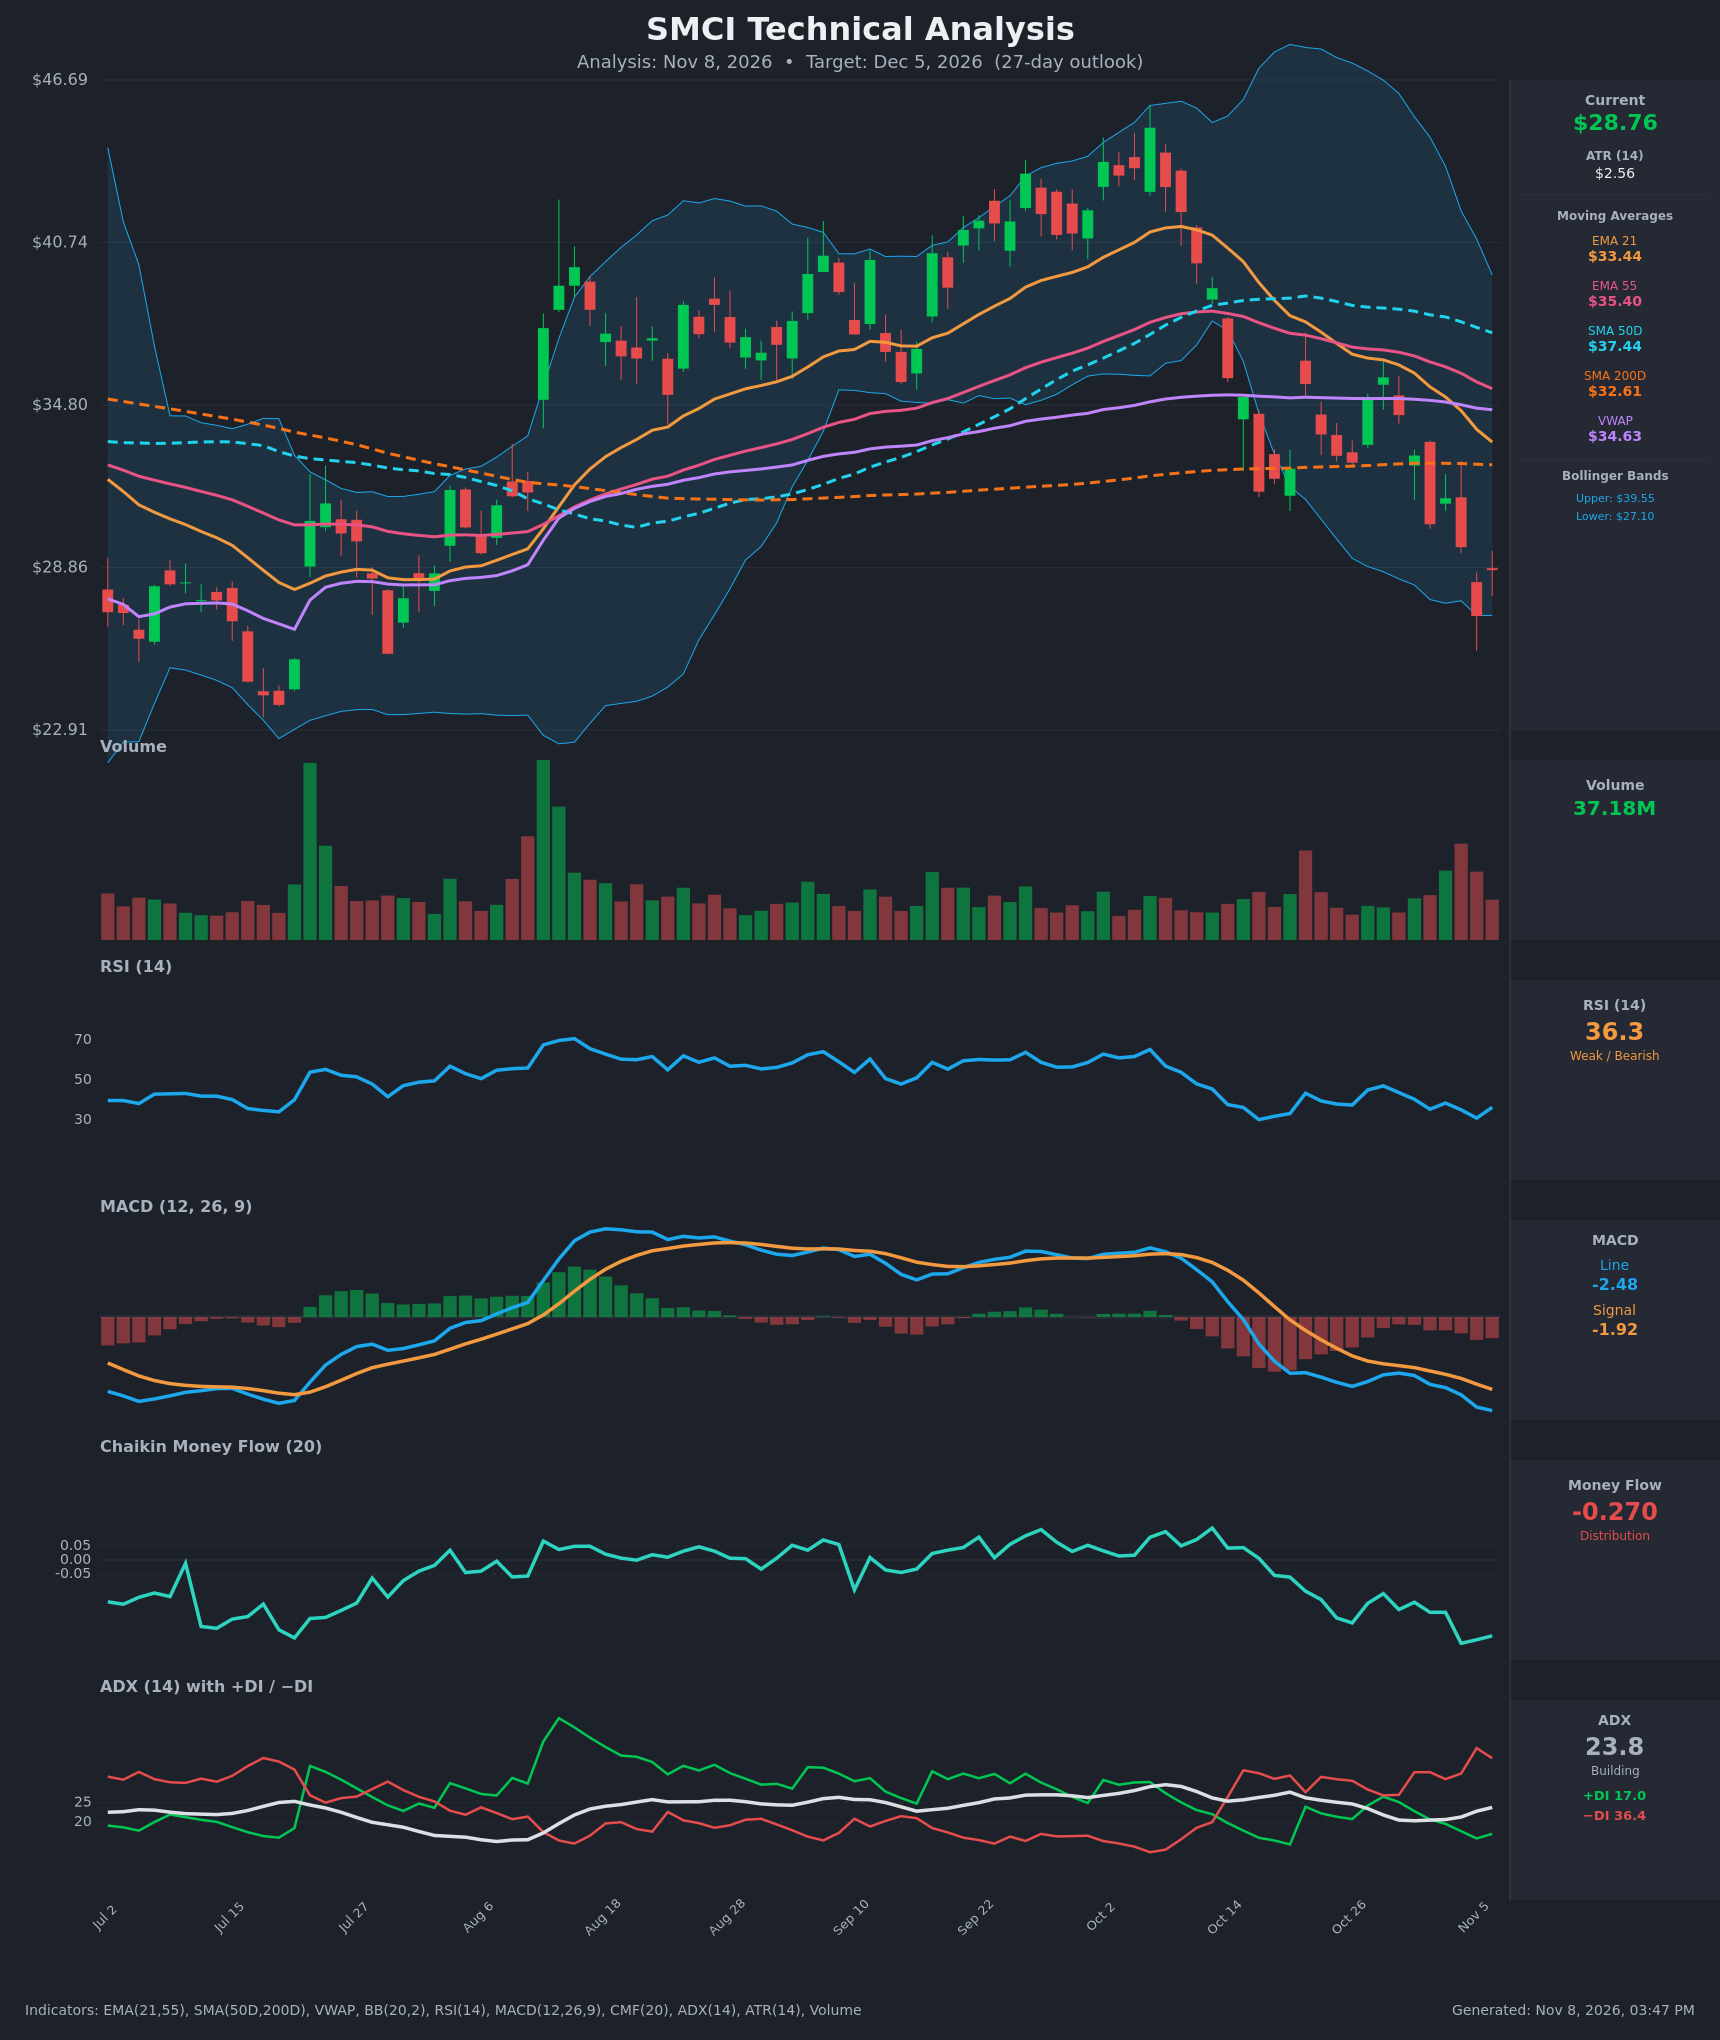
- RSI (14): 36.34, rebounding slightly off 31.0 on Nov 5 but still below 40. It has been under 50 since mid-October and is not yet oversold. Momentum is weak and the bounce is shallow. [Bearish]
- 20 EMA: The 21 EMA is $33.44 and price at $28.76 sits about 14% below it. The EMA is falling steeply, so it acts as overhead resistance. It has also crossed below the EMA 55 ($35.40), a bearish crossover. [Bearish]
- MACD: The line is -2.481 and the signal is -1.920. The line is below the signal and the gap is widening, and the histogram is increasingly negative. The bearish crossover happened in mid-October and momentum is still deteriorating. [Bearish]
- Bollinger Bands (20): Upper is $39.55, lower is $27.10, and price at $28.76 sits in the lower quarter of the bands. The Nov 5 close of $27.08 pierced the lower band. The bands are widening after the October drop, which signals a bearish expansion. A bounce toward the $33-34 midline is possible, but a band walk is also possible. [Bearish]
- CMF (20): -0.270, well below -0.05, and it has trended down from about -0.05 on Oct 19. This is persistent, heavy distribution. [Distribution]
- ADX (14): 23.8 and rising from 20.3, nearing the 25 threshold. −DI at 36.4 is far above +DI at 17.0, so bears are in firm control. [Building Trend – Bearish]
- Volume: 37.18M on the latest bar. Recent down candles have carried above-average volume, including the largest recent bars in late October and early November. The selling has been heavy and the bounces have been on lighter volume. [Bearish – selling pressure]
DIVERGENCES & TRENDS
- No bullish divergence yet. Price made a new low at $27.08 on Nov 5 and RSI made a similar low (31.0 against 30-ish in late October). The MACD line made a lower low, which confirms the decline rather than diverging from it.
- Moving average structure: The EMA21 crossed below the EMA55 in late October. Price has lost the SMA200D ($32.61), which is now overhead resistance, and it is also below the SMA50D ($37.44) and VWAP ($34.63). The SMA50D is still above the SMA200D, but the 50D is rolling over, and a death cross is plausible in the coming weeks.
- Lower highs: Each rally (Oct 21 at $35.57, Oct 28 at $35.81) failed at a lower level than the one before. Price is making lower highs and lower lows.
- Trend indicators: ADX is rising and −DI is expanding, which confirms a developing downtrend. CMF is still falling. The RSI bounce from 31 is the only sign of stabilization.
CHART PATTERNS
- Bearish Rising Wedge / Head and Shoulders (broader context): The July-October advance topped near $44-45 in early October. The sharp breakdown through the 21 EMA, 55 EMA, SMA200D and VWAP resembles a completed topping structure (a head-and-shoulders-style reversal with a lower-high retest). The measured move points to the low-to-mid $20s.
- Bearish Flag / Descending structure: The late-October bounces ($35.81 high) and the subsequent lower low suggest a continuation pattern inside a downtrend. A decisive break below $27 would target about $24-25, and then the July lows near $23.
- Counter-pattern: The sharp drop to the lower band could set up a technical relief bounce, but nothing resembling a Bullish Falling Wedge or Double Bottom has formed yet.
POTENTIAL SCENARIOS
- Scenario 1: Bearish Trend Continuation — Distribution, a dominant −DI and MACD still expanding lower keep sellers in control, and price grinds toward the July-August support zone. Trigger: a daily close below $27.00 (the lower Bollinger Band and the Nov 5 low). Target: $24.50, with an extension to $23.00. Invalidation: a daily close above $32.60 (the SMA200D). (50% probability)
- Scenario 2: Neutral/Bearish Relief Bounce, Then Failure — Price is oversold against the lower band and bounces toward the declining 21 EMA, then stalls under the SMA200D and rolls over. Trigger: a hold above $27 and a push through $30. Target: $30.50-$32.50, then a fade. Invalidation: a break above $33.50 on rising volume. (30% probability)
- Scenario 3: Bullish Reversal — Capitulation near $27 attracts buyers, CMF turns up and MACD crosses back up, and price reclaims the SMA200D. Trigger: a close above $33.00 with volume above 40M. Target: $34.60 (VWAP), then $35.40 (EMA 55). Invalidation: a close below $27.00. (20% probability)
PRICE TARGETS
For a 27-day horizon, the guideline range width is about 12-18% of the current price, and I'm using about 17%.
- Target Price: $26.50 (below current price, consistent with the bearish trend and an ATR-based expected drift of about 1x ATR)
- Expected Range: $23.00 to $32.00 (width $9.00, about 31%... self-check: this is too wide relative to the 12-18% guideline, so tightened below)
- Expected Range (final): $23.50 to $31.00 (width $7.50, about 26%). Because ATR is high at $2.56 (about 9% of price) and the stock is volatile, I'm keeping the range at the upper edge of, and slightly above, the 12-18% guideline.
- Key Levels: Support at $27.00 (Nov 5 low and lower Bollinger Band), Resistance at $32.61 (SMA200D)
Summary: Target Price $26.50, Expected Range $23.50 to $31.00, Support $27.00, Resistance $32.61.
OVERALL BIAS
OVERALL BIAS: BEARISH - Price is below every key moving average and VWAP. The MACD is widening to the downside, CMF is at -0.270 (heavy distribution), and −DI is more than double +DI with ADX rising. The only offsetting factor is a possible oversold relief bounce, which should meet resistance at $32.61 or below.
This is educational analysis and not financial advice.