SPCX 27-day bearish forecast — Nov 8, 2026
- Bias: Bearish
- Timeframe: 27 days (made Nov 8, 2026, target date Dec 4, 2026)
- Price at analysis: $134.27
- Price target: $127.50
- Expected range: $116.00 – $140.00
- Result: Pending — graded after the close on Dec 4, 2026
Get a free AI analysis of SPCX today
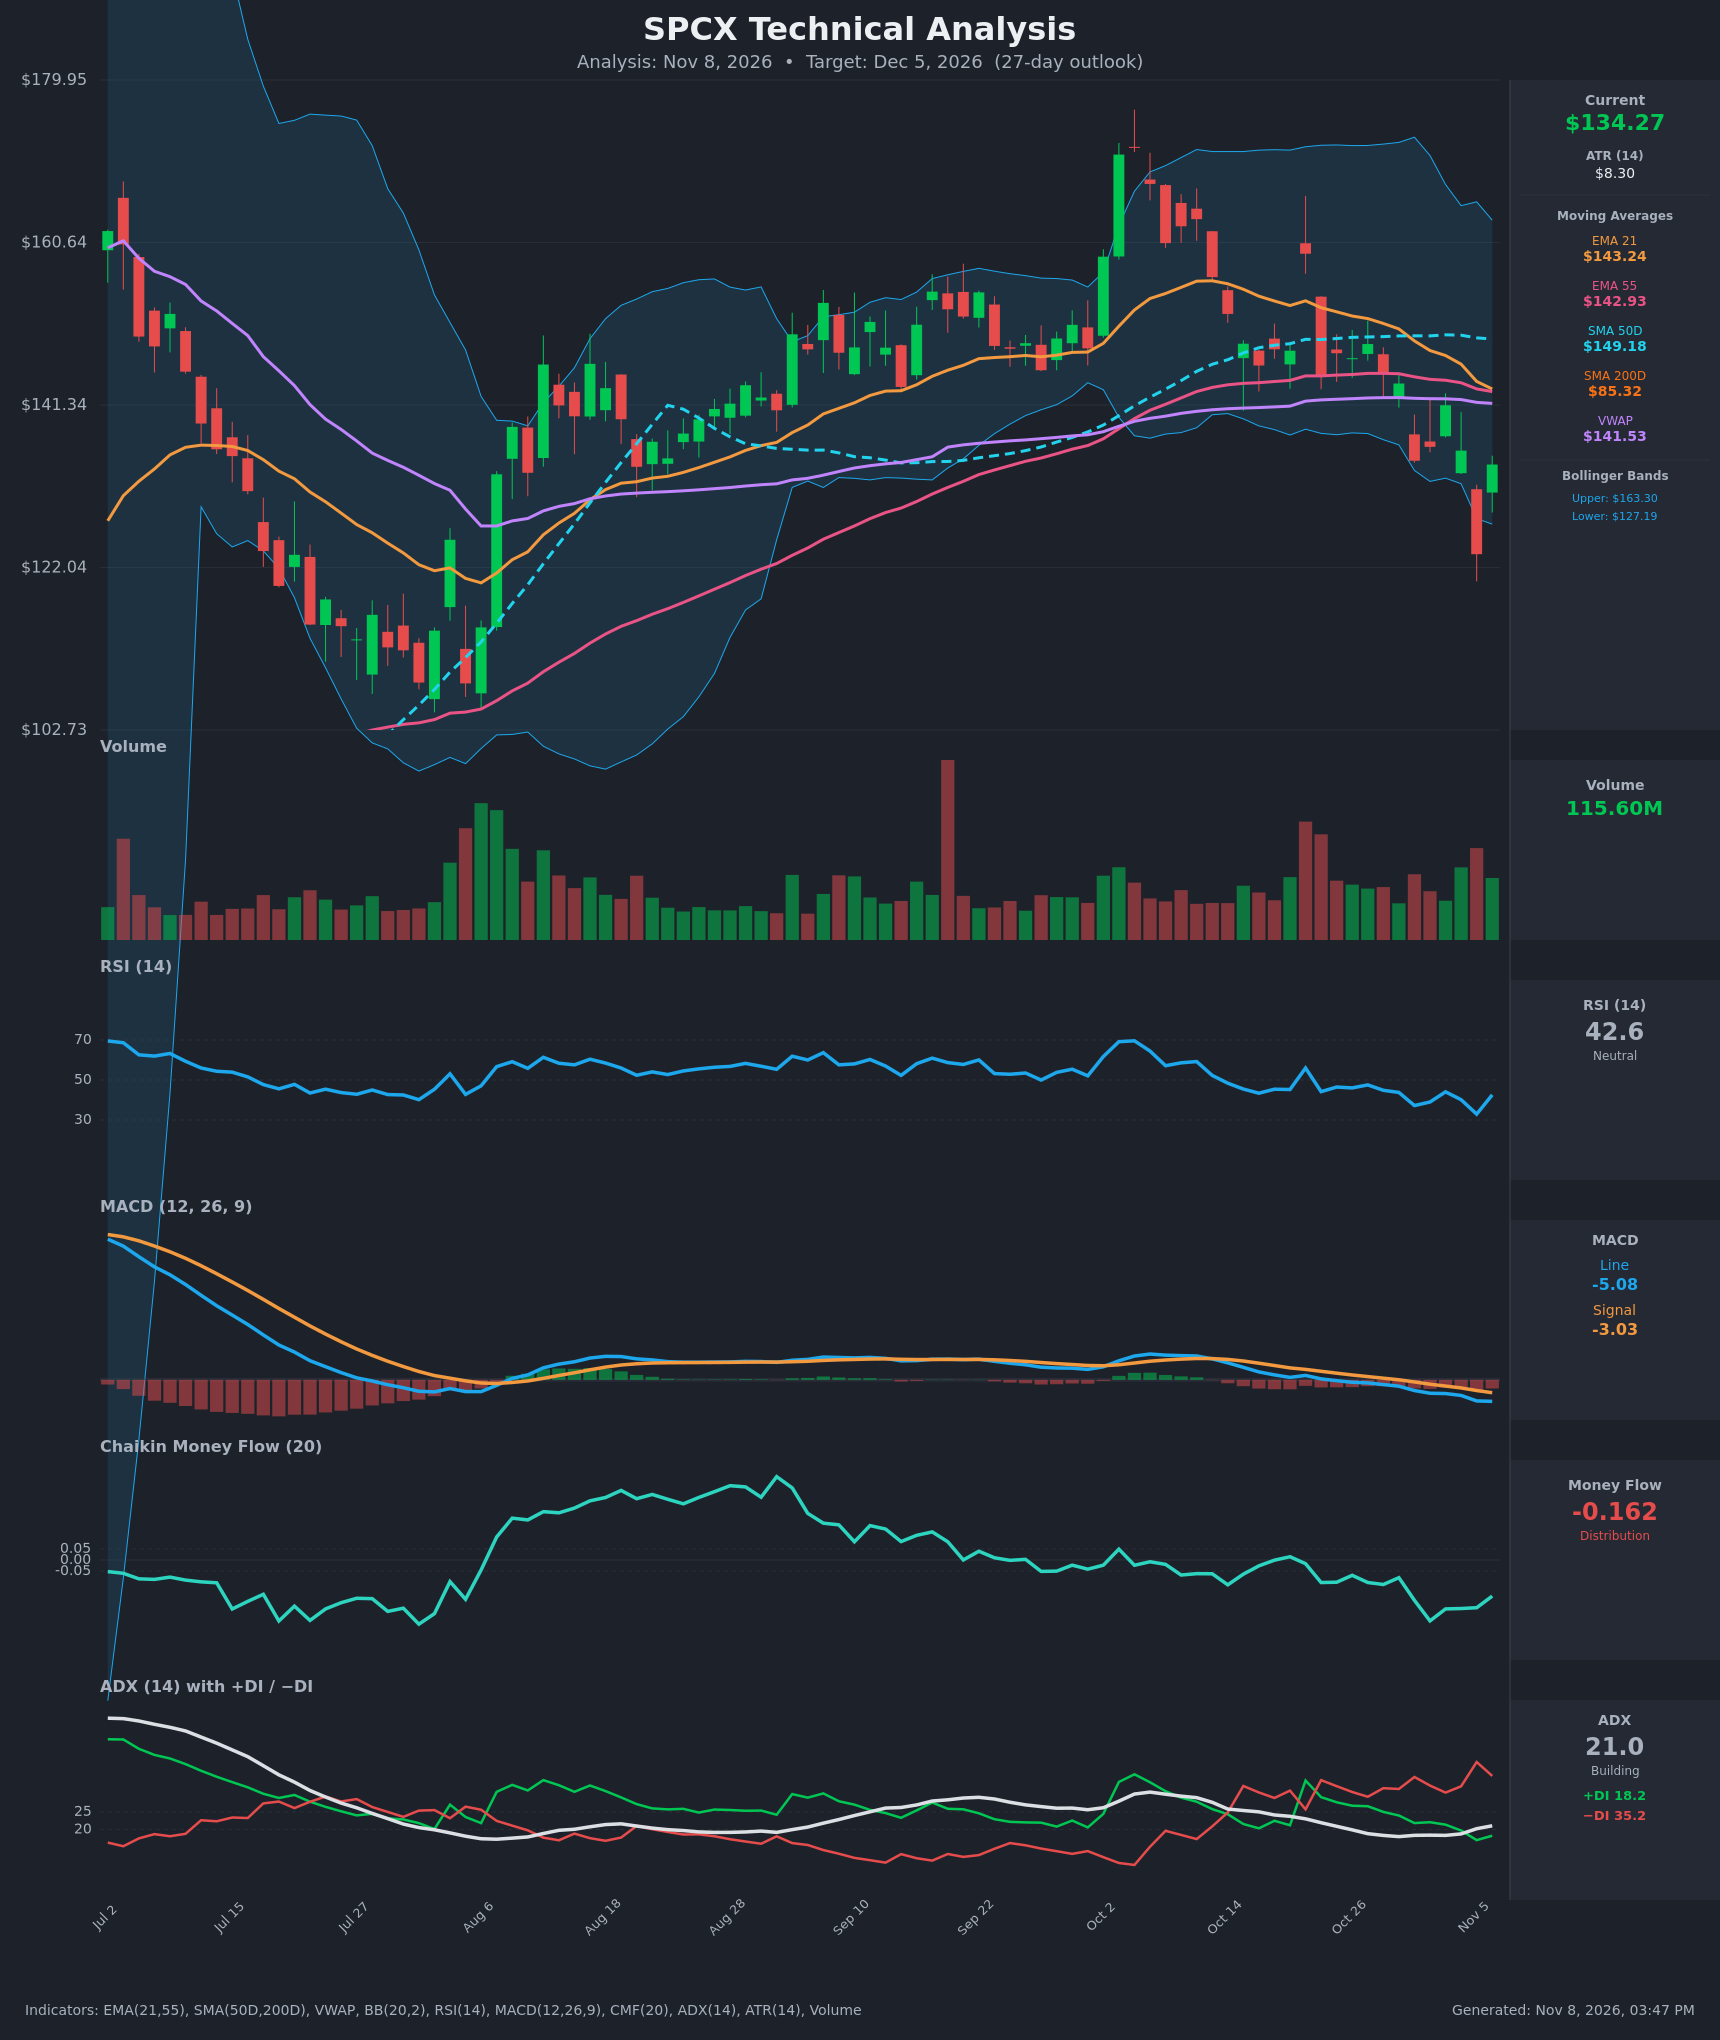
Analysis
TECHNICAL INDICATORS
- RSI (14): 42.56, recovering from 32.9 on Nov 5 (near oversold) but still below 50 and under its mid-Oct range of 45-56. The bounce is a relief move, not yet a momentum shift. [Bearish]
- 20 EMA (EMA 21): $143.24, about 6.7% above the $134.27 price. EMA21 has fallen from $153.7 (Oct 21) and is about to cross below EMA55 ($142.93). The gap is only $0.31. Price is below both, so they act as resistance. [Bearish]
- MACD: Line -5.08 is below Signal -3.03, and the gap has widened for two weeks. The histogram is negative and expanding. The bearish crossover occurred around Oct 30 and has not reversed. [Bearish]
- Bollinger Bands (20): Upper $163.30, lower $127.19, midline about $145.2. Price sits in the lower third of the band, having pierced the lower band on Nov 5 (close $123.62) and bounced back inside. The bands are wide from the early-October spike. A close back inside the lower band after a break often yields a bounce toward the midline, but the midline coincides with overhead resistance. [Neutral]
- CMF (20): -0.162, well below -0.05 and negative since mid-October, with a low of -0.274. Sustained distribution, with sellers using rallies to exit. [Distribution]
- ADX (14): 21.0, rising from 18.0 on Oct 29. −DI (35.2) is far above +DI (18.2), and the gap has widened since Nov 3. The trend is not yet strong (<25), but it is building to the downside. [Weak but Strengthening Trend – Bearish]
- Volume: 115.60M, above the recent average. It came on the green rebound bar after the Nov 5 flush. Heavy volume on the drop and on the bounce suggests capitulation selling plus some dip-buying, but a single bounce day does not confirm a reversal. [Neutral to Mildly Bearish]
Other levels:
- VWAP ($141.53): price is below it, which signals sellers in control.
- SMA50D ($149.18): price is below it, and the average is flat.
- SMA200D ($85.32): price is far above it. The long-term uptrend is intact, and a death cross is not a concern.
DIVERGENCES & TRENDS
- Divergences: There is no clean divergence. RSI made a higher low on Nov 6 (42.6) against the Nov 5 low (32.9) only because of the one-day bounce, and the MACD line made a new low, so momentum is not confirming a bottom. CMF is making lower lows alongside price, which confirms the weakness.
- Trends:
- Price has made lower highs since the $170+ spike around Oct 2 and now trades below the 21 and 55 EMAs and the 50-day SMA.
- The MACD is accelerating lower.
- −DI has dominated +DI since Oct 28 except for a brief spike on Oct 21.
- Crossovers and breaks:
- MACD bearish crossover around Oct 30.
- EMA21 is about to cross below EMA55. The two have converged from $153.7 vs $144.8 to $143.2 vs $142.9, so this is a near-term bearish signal.
- Price broke below the $140-$145 consolidation zone that held through Sep and Oct, with a Nov 5 wick below the lower Bollinger Band.
- The 50-day SMA is flat at $149, and a roll-over would add pressure.
CHART PATTERNS
- Bearish breakdown from a range, resembling a Bearish Flag/Rectangle: After the early-October spike, price consolidated between roughly $140 and $155, then broke down on Oct 30 and Nov 5. The measured move from a range of that height points to roughly $120-$125.
- Lower highs: The $170 peak, the $159 high on Oct 21 and the $147-$148 highs form a descending sequence similar to a Descending Triangle/Bearish Pennant. Support near $123-$127 is the immediate test.
- Counter-signal: The Nov 5 long lower wick and the Nov 6 rebound hint at a possible short-term Double Bottom or "Bullish Falling Wedge" bounce. This needs a close above $141-$143 (VWAP/EMA21) to be credible. Until then it is only a relief rally.
POTENTIAL SCENARIOS
- Scenario 1: Bearish Continuation Lower — The relief bounce fades at the VWAP/EMA zone, EMA21 crosses below EMA55, and sellers retest the Nov 5 low. Trigger: rejection at $138-$142 or a close below $127. Target: $120-$125 (the measured move from the broken range). Invalidation: daily close above $143.50 (EMA21). (50% probability)
- Scenario 2: Neutral Choppy Base — Price stabilizes after the capitulation wick and trades between roughly $124 and $141 as RSI resets. Trigger: holds above $123.60 with fading selling volume. Target: $130-$138. Invalidation: close outside the $123-$142 range. (30% probability)
- Scenario 3: Bullish Relief Rally and Reclaim — A sharp rebound, helped by the oversold reading on Nov 5, reclaims VWAP and the EMAs, moving toward the 50-day SMA. Trigger: close above $143.50 with CMF turning positive. Target: $149-$152. Invalidation: loss of $128 on a closing basis. (20% probability)
PRICE TARGETS
- Target Price: $127.50 (27-day, about -5% from current)
- Expected Range: $116.00 to $140.00 (width $24.00, about 17.9% of price, in line with the 12-18% guidance for 30-60 days, applied conservatively for 27 days)
- Key Levels: Support at $123.62 (Nov 5 close/low area), Resistance at $141.53 (VWAP, with EMA21 at $143.24 just above)
OVERALL BIAS
OVERALL BIAS: BEARISH - Price is below the 21/55 EMAs, VWAP and 50-day SMA. MACD is bearish and widening, CMF shows persistent distribution, and −DI (35.2) dominates +DI (18.2) with ADX rising. The Nov 6 bounce looks like relief inside a downtrend, with overhead resistance at $141-$143 and a likely retest of the $123-$127 area. Conviction is moderate because the RSI bounce and the long-term SMA200 uptrend leave room for a counter-trend rally.
This is educational analysis and not financial advice.