TLT 27-day bullish forecast — Nov 8, 2026
- Bias: Bullish
- Timeframe: 27 days (made Nov 8, 2026, target date Dec 4, 2026)
- Price at analysis: $81.92
- Price target: $83.00
- Expected range: $77.00 – $87.00
- Result: Pending — graded after the close on Dec 4, 2026
Get a free AI analysis of TLT today
Analysis
TECHNICAL INDICATORS
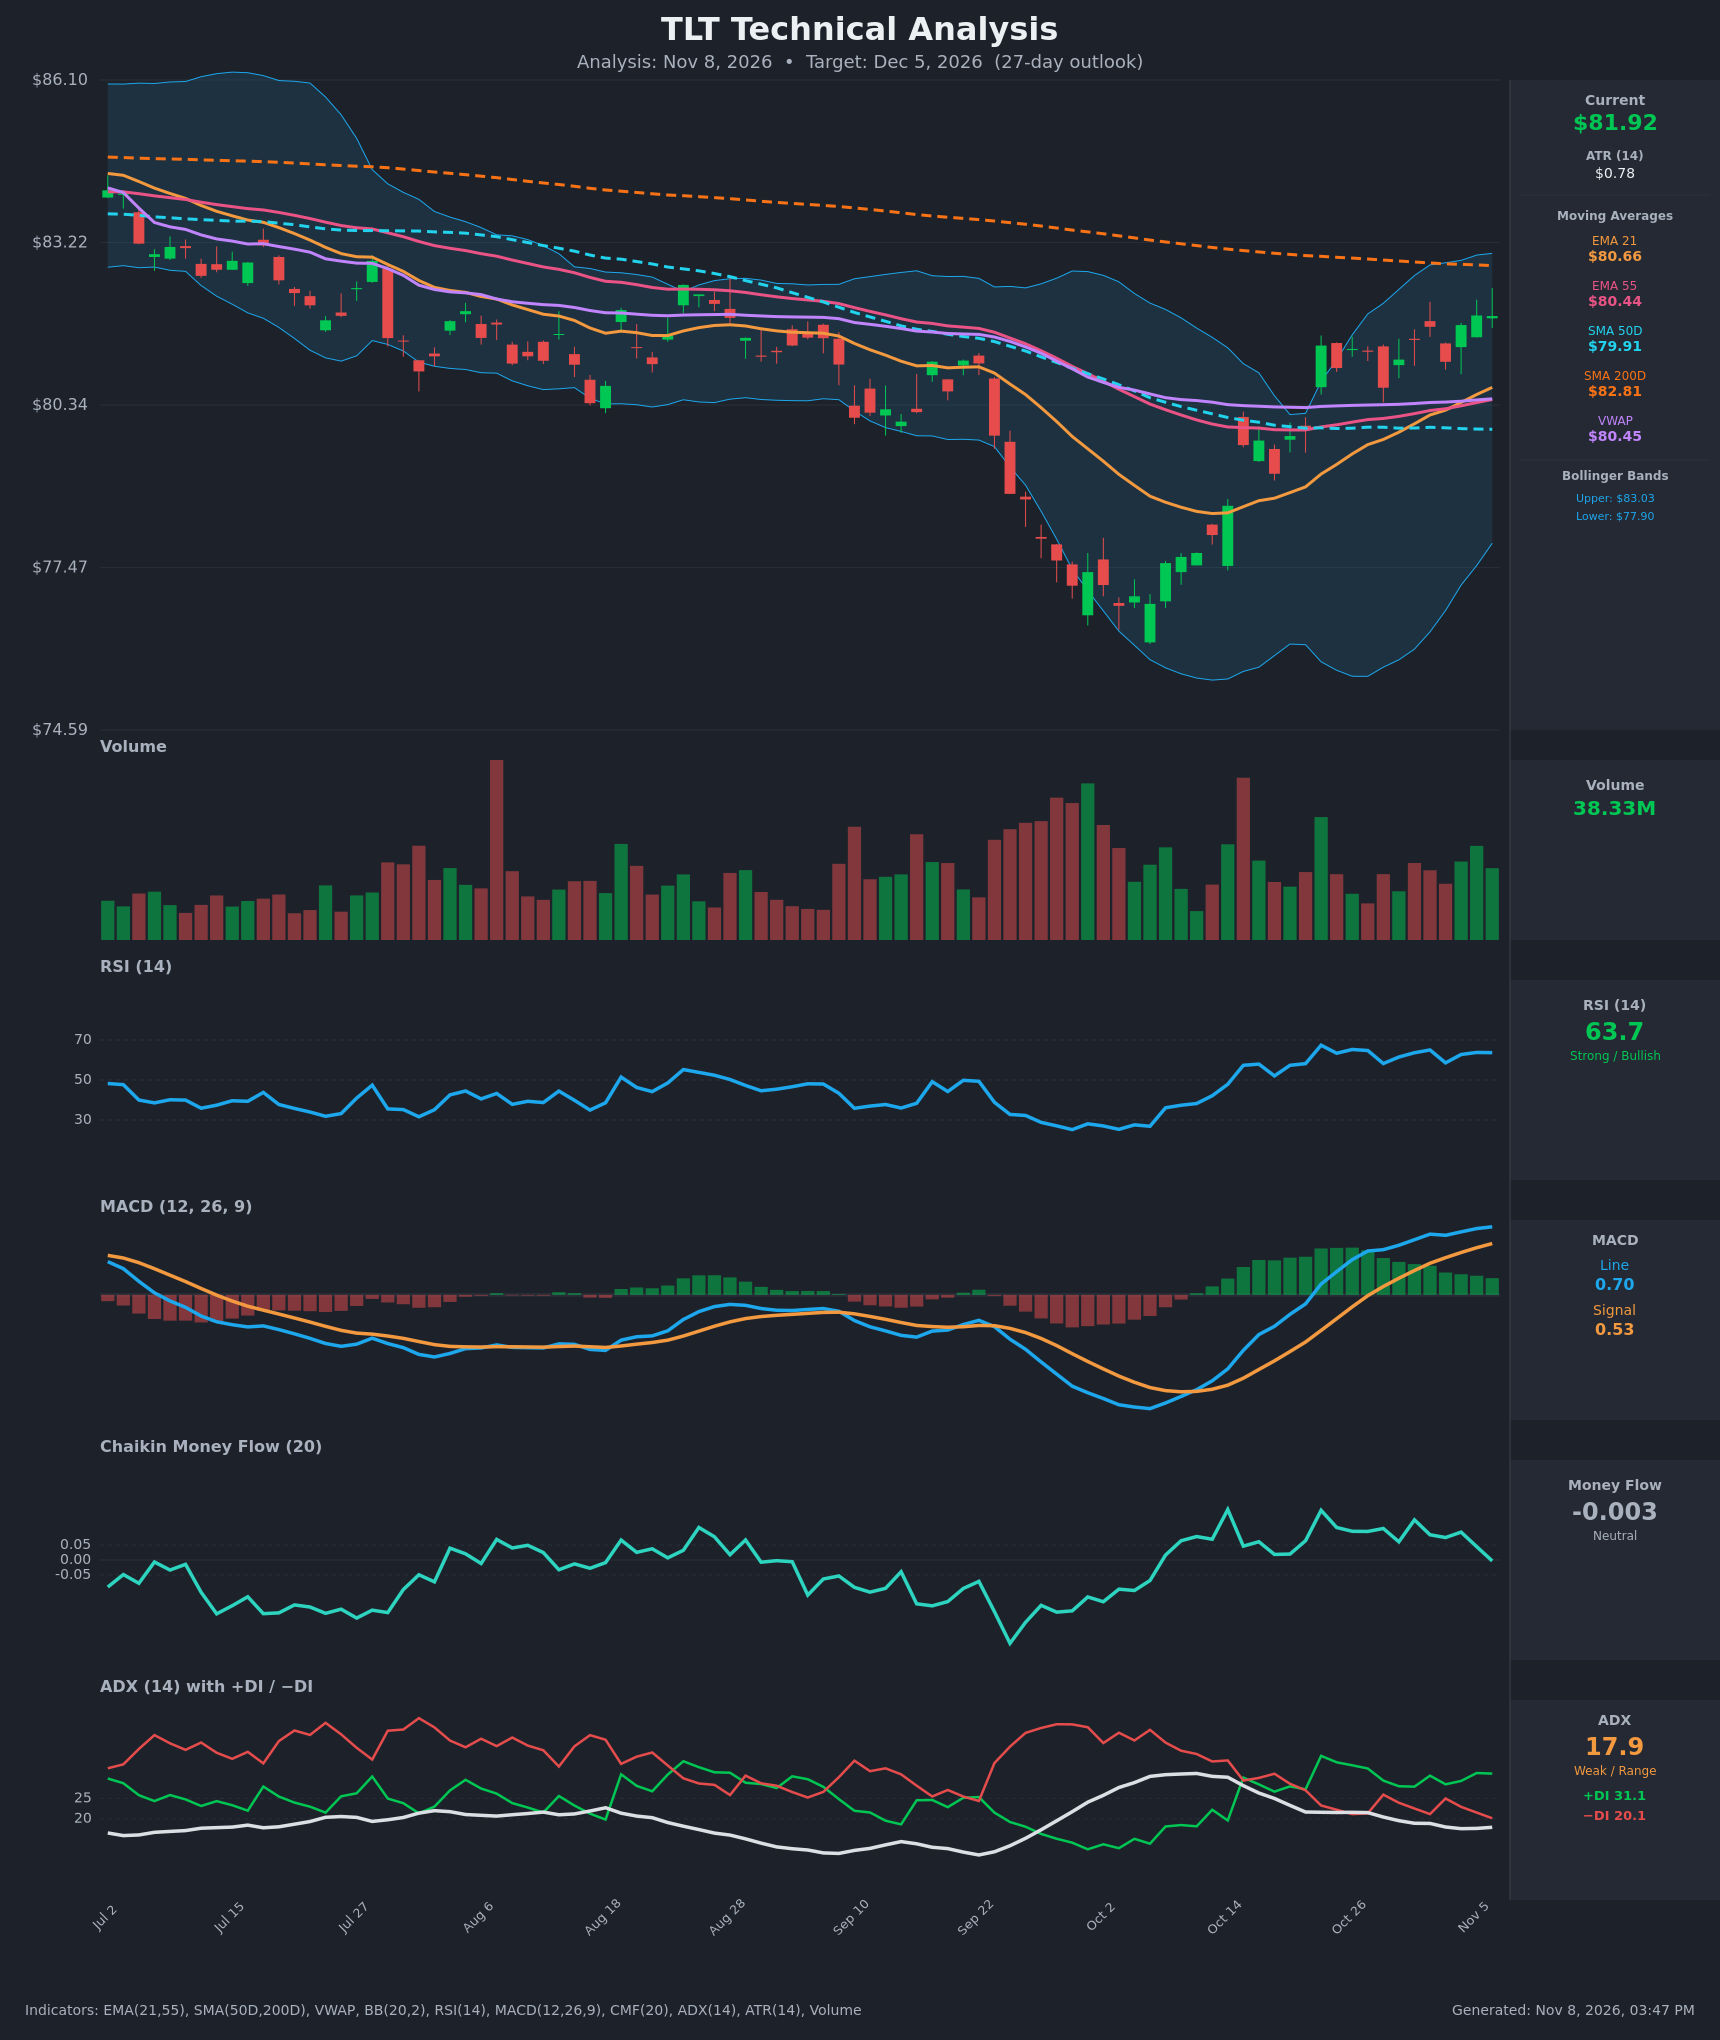
- RSI (14): 63.66, in bullish territory but below 70. It has held in a 58–67 band since Oct 22, so momentum is steady rather than accelerating. [Bullish]
- 20 EMA (EMA 21): $80.66, with price at $81.92 about 1.6% above it. EMA21 has crossed above EMA55 ($80.44) in the last few bars, so short-term trend support is rising. [Bullish]
- MACD: Line 0.702 is above Signal 0.529, a bullish crossover that occurred around Oct 28. The line and histogram are both positive and still widening slightly. [Bullish]
- Bollinger Bands (20): Upper $83.03, lower $77.90, midline about $80.46. Price is in the upper third of the bands, and the bands are widening after the squeeze and low in October. The upper band sits right at the SMA200 (about $82.8), creating a resistance cluster. [Neutral]
- CMF (20): -0.003, neutral. It has faded from about +0.13 on Oct 30 and +0.17 on Oct 22 while price kept making higher closes, so buying pressure is waning. [Neutral]
- ADX (14): 17.9 and falling, so the trend is weak or range-bound. +DI (31.1) is well above −DI (20.1), so bulls hold directional control, but without trend strength behind it. [Weak Trend, Bullish lean]
- Volume: 38.33M, with recent green bars larger than the red ones. That shows modest participation behind the rebound, but no capitulation or breakout-level surge. [Mildly Bullish]
DIVERGENCES & TRENDS
- Moving averages: Price is above EMA21, EMA55, SMA50D ($79.91) and VWAP ($80.45), which is a short- and medium-term uptrend. It is still below the SMA200D ($82.81), which is falling, so the long-term trend remains down. SMA50D is below SMA200D, so no golden cross is near, and the SMA200D is the key overhead hurdle.
- CMF divergence: CMF has dropped from positive to zero while price made new highs near $81.9. This is a mild bearish divergence that warns the rally may stall.
- ADX divergence: ADX is falling below 20 even as price rises. The advance is a drift off the Oct 14 low, not a powerful new trend.
- MACD and RSI: MACD crossed up and its histogram expanded, which confirms the bounce. RSI has flattened at 63–65 instead of making new highs.
- Trend: The Jul–Oct downtrend (lower highs and lows) was broken with a sharp V-shaped recovery from about $76 to $82.
CHART PATTERNS
- V-shaped reversal and down-channel breakout: The decline from July to October looked like a bearish channel, loosely a falling wedge or expanding structure. Price broke out above the channel and the EMAs, which resembles the Bullish Falling Wedge reversal in the reference diagram. The measured move toward the prior breakdown zone ($83–84) is consistent with this.
- Resistance zone: The SMA200D ($82.81), the upper Bollinger Band ($83.03) and the late-Aug/Sep breakdown area at about $83 form a stacked ceiling. A move through $83.50 would confirm the reversal, and a rejection could form a Bearish Double Top or range.
- No clean continuation pattern yet. The pattern read is moderately bullish with a modest upside target, about $83–84.
POTENTIAL SCENARIOS
- Scenario 1: Bullish Breakout Above the SMA200 — Price consolidates above the EMAs, then clears the $82.81–$83.03 resistance cluster as the MACD uptrend continues and bulls hold DI control. Trigger: daily close above $83.10 on rising volume. Target: $84.50–$85.50. Invalidation: close below $80.40, which is the EMA21/55 and VWAP cluster. (40% probability)
- Scenario 2: Neutral Range Between the MA Support and Resistance — With ADX below 20 and fading CMF, price chops between $80.50 and $83.00 for most of the period. Trigger: repeated failures at the SMA200 and the upper band, with support at the EMAs. Target: $81.00–$82.50. Invalidation: a decisive close outside $80.20–$83.50. (30% probability)
- Scenario 3: Bearish Rejection and Pullback — The SMA200 and upper-band resistance holds, CMF turns negative, and price falls back through the EMAs, confirming a lower high in the larger downtrend. Trigger: daily close below $80.40. Target: $78.50–$79.90 (SMA50D and the middle-to-lower band). Invalidation: close above $83.30. (30% probability)
PRICE TARGETS
- Target Price: $83.00 (27-day target)
- Expected Range: $77.00 to $87.00 (width $10.00, about 12.2% of current price, consistent with the 30–60 day band scaled for 27 days)
- Key Levels: Support at $80.45, Resistance at $82.81
OVERALL BIAS
OVERALL BIAS: BULLISH - Price is above the EMAs, SMA50D and VWAP, with a bullish MACD crossover, RSI at 63.7, +DI well above −DI and a V-shaped break of the downtrend. Conviction is modest because the SMA200 and upper Bollinger Band cluster is just overhead, ADX is below 20 and CMF is fading to neutral.
This is educational analysis and not financial advice.