TQQQ 27-day bearish forecast — Nov 8, 2026
- Bias: Bearish
- Timeframe: 27 days (made Nov 8, 2026, target date Dec 4, 2026)
- Price at analysis: $52.25
- Price target: $49.50
- Expected range: $45.50 – $55.00
- Result: Pending — graded after the close on Dec 4, 2026
Get a free AI analysis of TQQQ today
Analysis
TECHNICAL INDICATORS
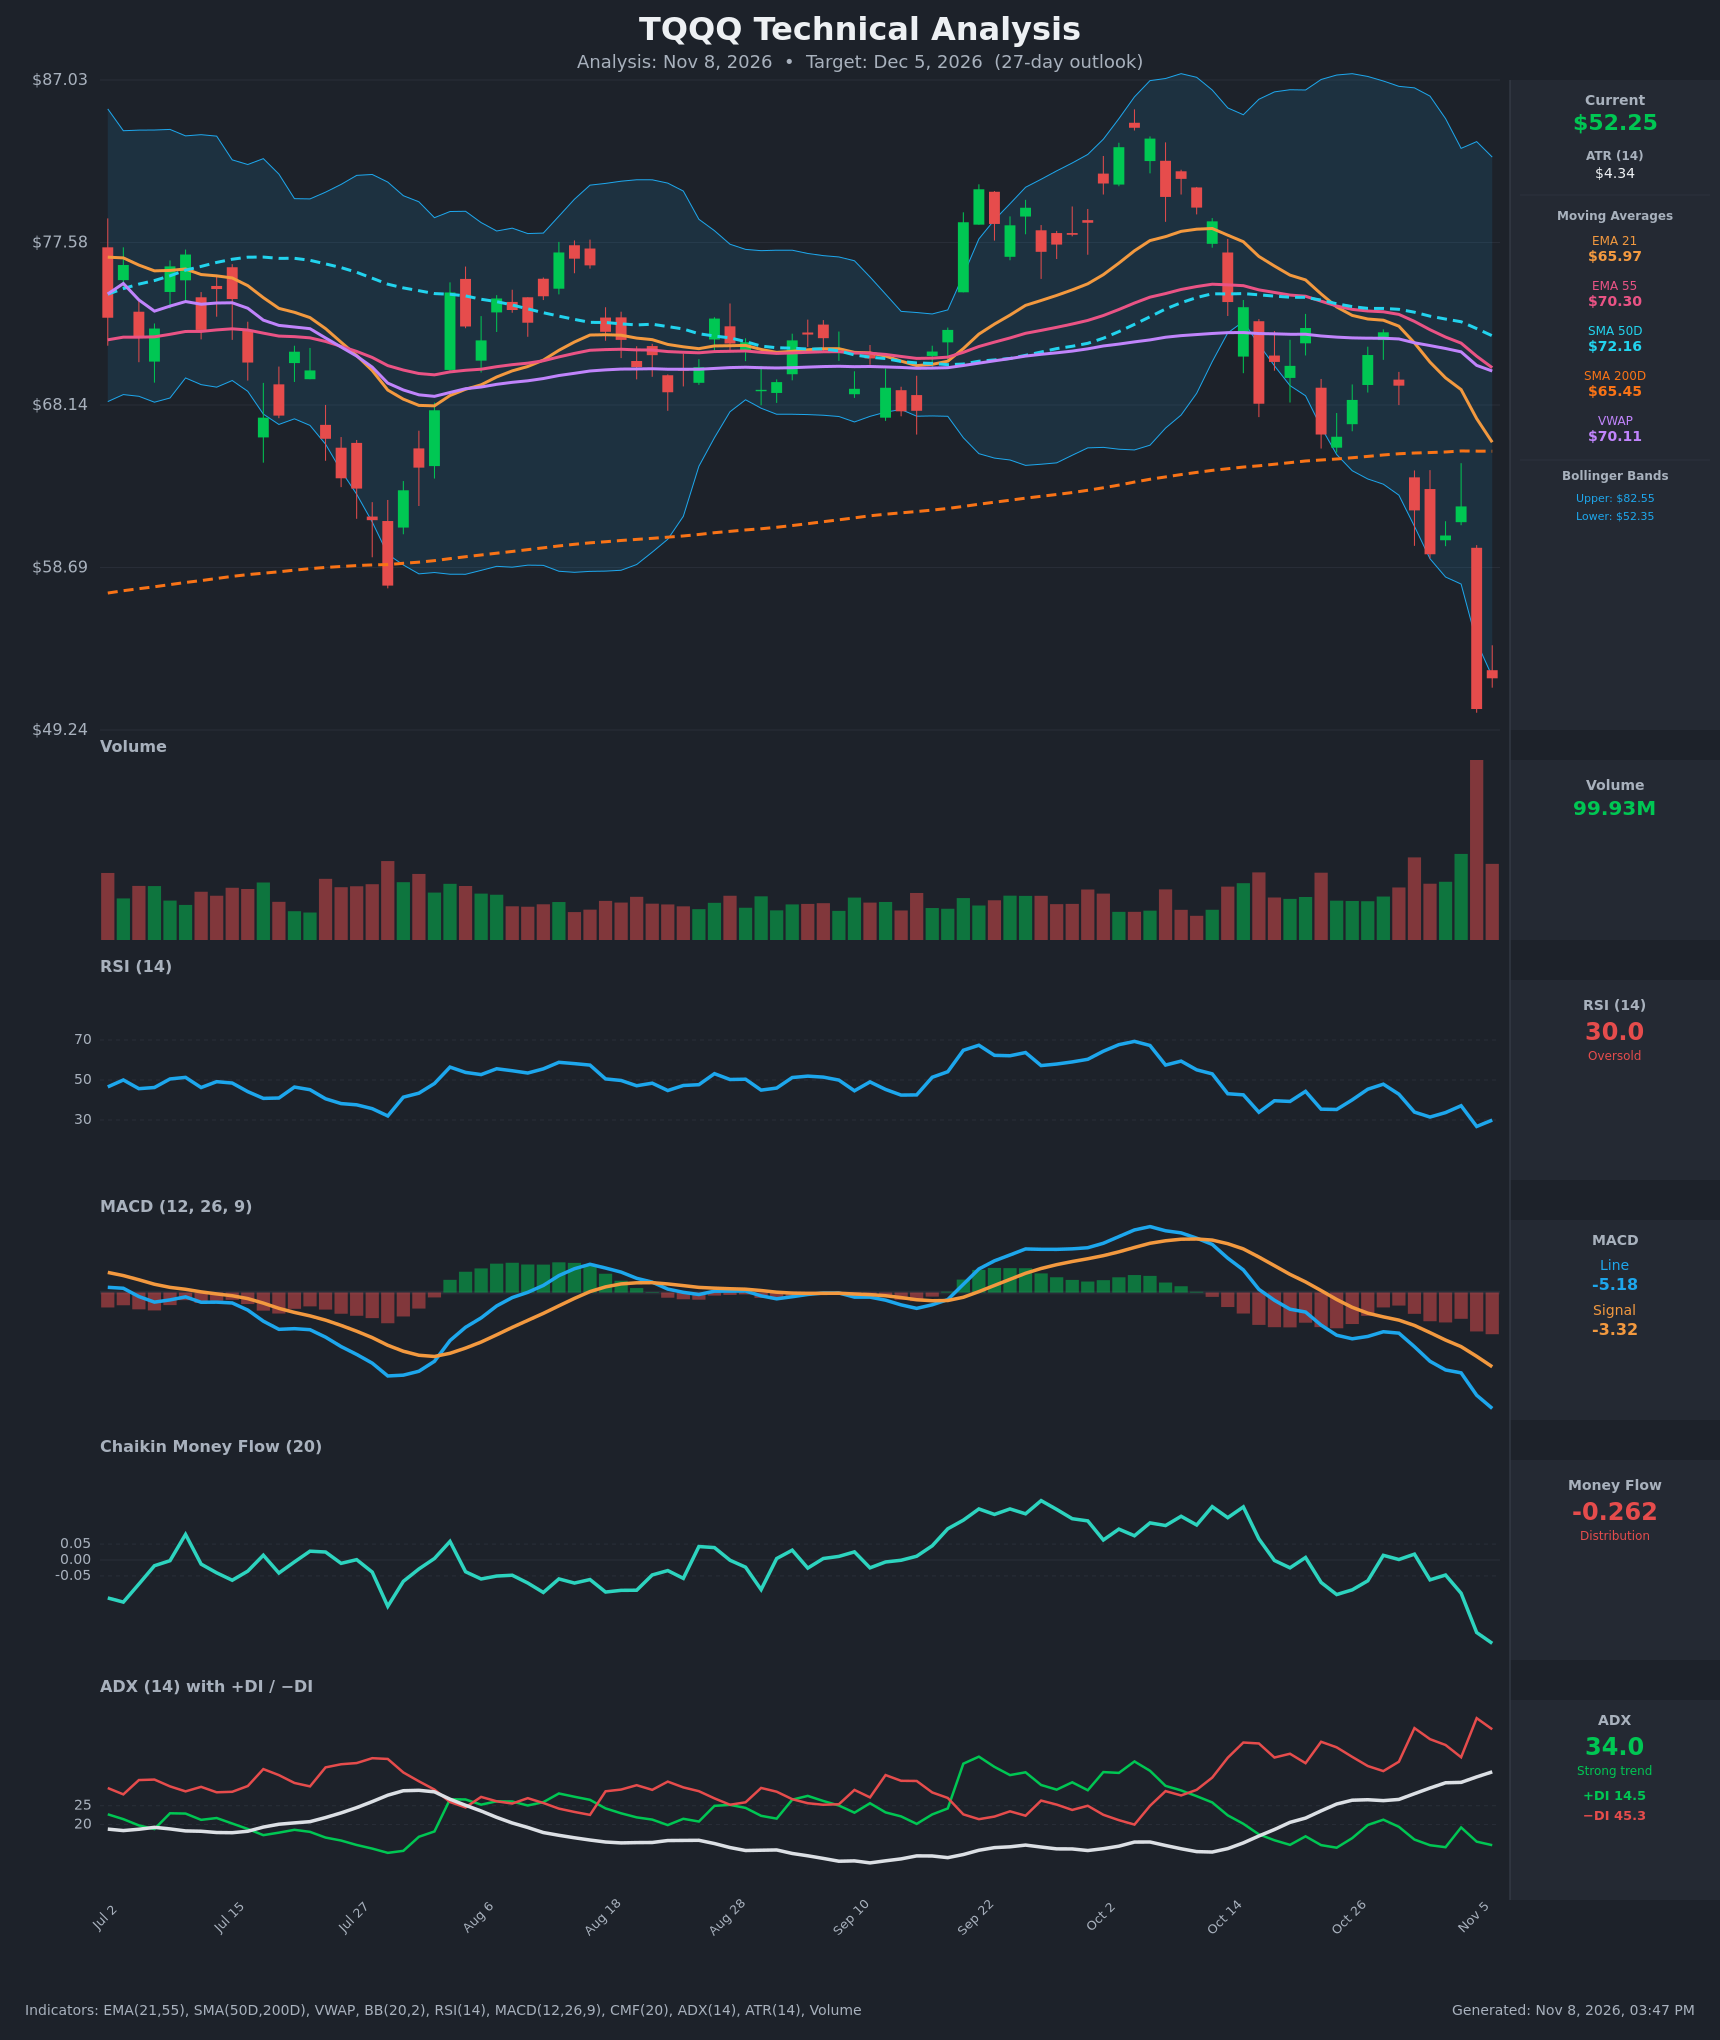
- RSI (14): 29.96, right at the oversold line after a low of 26.8 on Nov 5. It has fallen from 47.9 on Oct 28 and is only just bouncing. There is no bullish divergence yet, since the RSI low sits with the price low. [Bearish]
- 20 EMA: The 21 EMA is $65.97 and falling fast. Price is about 21% below it, so it acts as heavy overhead resistance. The 21 EMA crossed below the 55 EMA ($70.30) around Oct 21-22, which is a bearish crossover. [Bearish]
- MACD: The line is -5.18, below the signal at -3.32, and the histogram is increasingly negative. The bearish crossover happened around Oct 22-23 and the gap keeps widening, so downside momentum is accelerating. [Bearish]
- Bollinger Bands (20): Price is $52.25 against a lower band of $52.35, so it is riding or slightly below the lower band. The bands have expanded sharply (upper $82.55), which signals a volatility-driven downtrend. A close back inside the band could start a relief bounce, but "walking the band" is common in strong trends. [Bearish]
- CMF (20): -0.262, deep distribution and the lowest reading in the visible window. It has fallen steadily from positive territory in early October. [Distribution]
- ADX (14): 34.0 and rising, with −DI at 45.3 far above +DI at 14.5. This is a strong, established downtrend with the bears fully in control. [Strong Trend – Bearish]
- Volume: 99.93M. Nov 5 had the largest volume spike in the window on a roughly -19% candle, which is capitulation-like. The Nov 6 bounce came on lower volume, so buyers have not yet shown conviction. [Bearish with possible exhaustion]
DIVERGENCES & TRENDS
- There is no confirmed bullish divergence. RSI, MACD and CMF all made new lows along with price.
- The moving average structure is bearish: price < VWAP ($70.11) < EMA 55 ($70.30) < SMA50D ($72.16). The 21 EMA also broke below the SMA200D ($65.45), and price is about 20% below the SMA200D.
- The SMA50D remains above the SMA200D, so there is no death cross yet. The 50D is rolling over and the gap is narrowing.
- MACD and the DI lines both trend lower. CMF fell from about +0.1 in early October to -0.26.
- The only counter-signals are stretched conditions: RSI near 30, price at the lower Bollinger Band and a climactic volume bar. These raise the odds of a relief bounce but do not show a trend change.
CHART PATTERNS
- The closest reference pattern is a Bearish Rising Wedge / Double Top reversal. The September-October peak near $85 was followed by a lower high and then a breakdown through the 200D and the lower range. The measured move of that top points to the current zone and lower.
- A Bullish Falling Wedge is not present. The decline is a steep, near-vertical drop with no converging structure, so there is no bullish reversal confirmation.
- The July 27 low (about $58) was the prior support. It was broken decisively and is now resistance, which is typical of a breakdown continuation.
- The Nov 5 candle is a large gap-like capitulation bar. A relief rally toward $56-58 would be a normal retest of the broken area. Without a base, the larger structure favors continuation lower.
POTENTIAL SCENARIOS
- Scenario 1: Bearish Trend Continuation — Downtrend momentum persists (ADX rising, −DI dominant, MACD widening). Price pushes lower after a weak bounce. Trigger: failure to reclaim $56-57 and a close below $49.25. Target: $49.50 by the 27-day mark, with an extension to about $46. Invalidation: daily close above $58. (50% probability)
- Scenario 2: Bullish Oversold Relief Bounce — RSI near 30, price at the lower Bollinger Band and capitulation volume trigger a mean-reversion bounce. Trigger: a close above about $56 on rising volume with MACD histogram contraction. Target: $58-60, a retest of the broken $58 support. Invalidation: a close below $49.25. (38% probability)
- Scenario 3: Neutral Basing Range — Price stabilizes after the capitulation and chops between about $49 and $56 as volatility cools. Trigger: tight candles on declining volume. Target: about $52-53. Invalidation: a break of either range boundary. (12% probability)
PRICE TARGETS
For the 27-day horizon (to about Dec 5, 2026):
- Target Price: $49.50
- Expected Range: $45.50 to $55.00 (width $9.50, about 18% of current price, in line with the 30-60 day guidance)
- Key Levels: Support at $49.25 (Nov 5 low and chart floor), Resistance at $58.00 (broken July low area; nearer minor resistance at the $52.35 lower Bollinger Band and the $56 bounce zone)
OVERALL BIAS
OVERALL BIAS: BEARISH - Price is far below every moving average with ADX at 34 and −DI dominant. MACD and CMF keep deteriorating, and there is no bullish divergence or base yet. The oversold RSI makes a relief bounce likely, but the trend evidence still favors lower prices.
This is educational analysis and not financial advice.