XLE 27-day bearish forecast — Nov 8, 2026
- Bias: Bearish
- Timeframe: 27 days (made Nov 8, 2026, target date Dec 4, 2026)
- Price at analysis: $61.62
- Price target: $60.40
- Expected range: $55.70 – $64.60
- Result: Pending — graded after the close on Dec 4, 2026
Get a free AI analysis of XLE today
Analysis
TECHNICAL INDICATORS
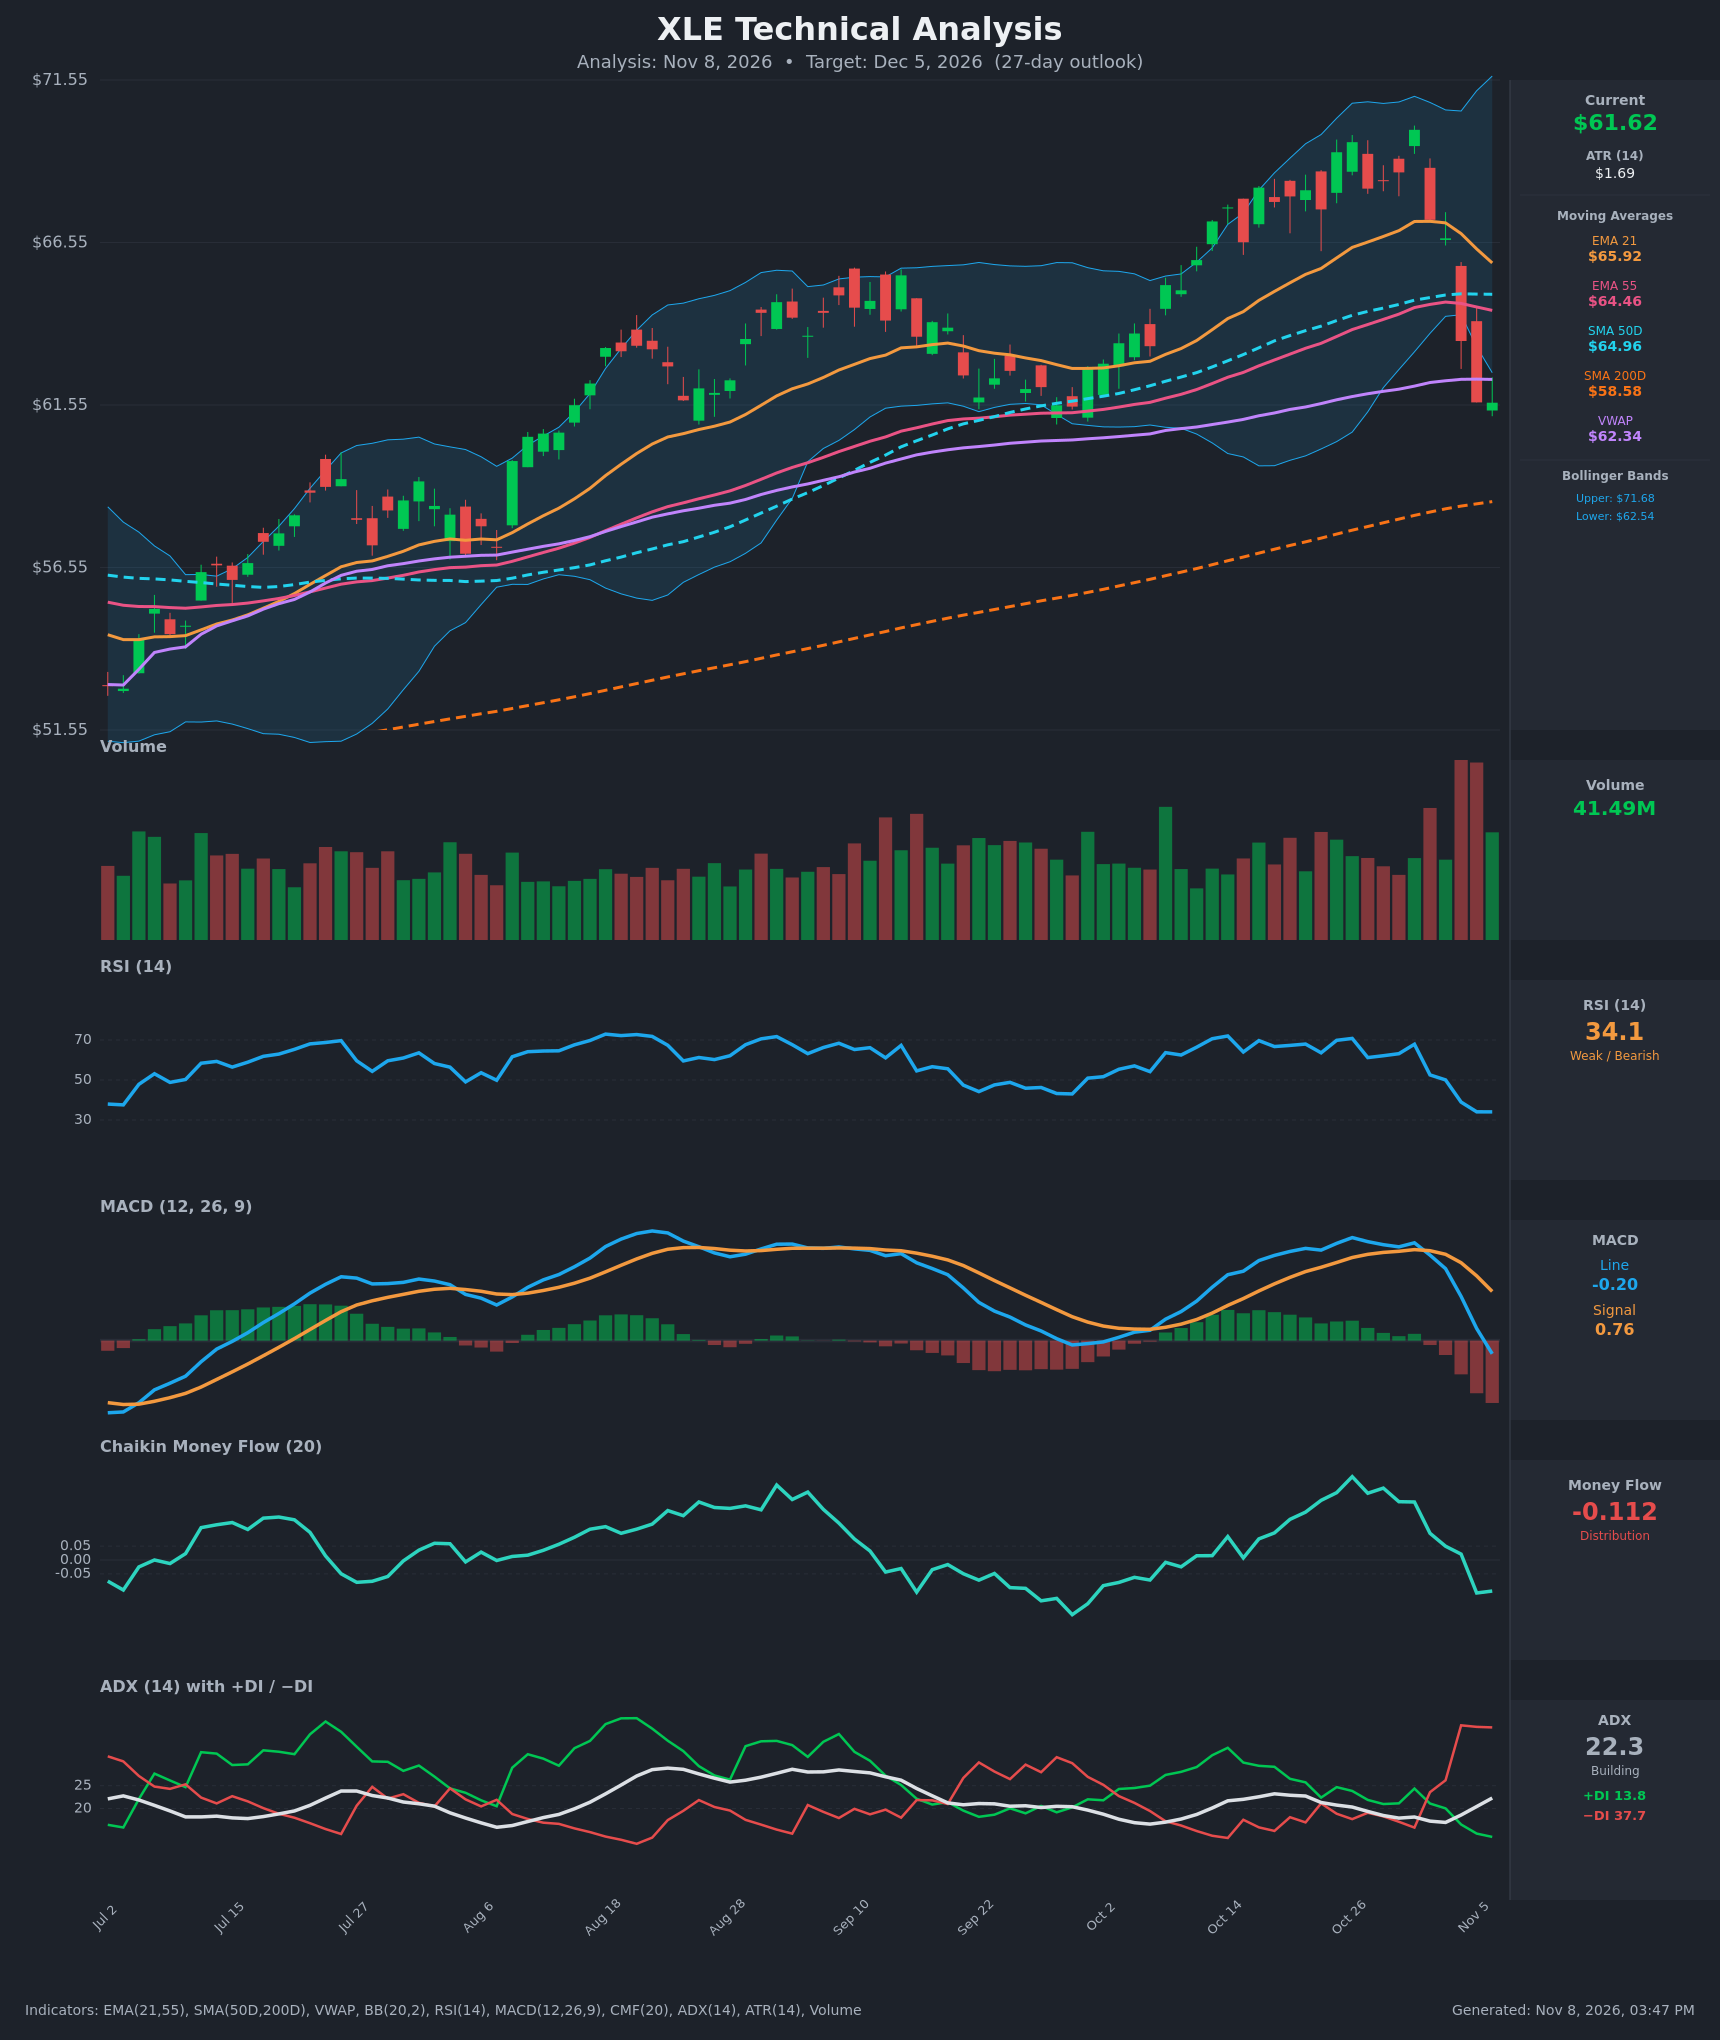
- RSI (14): 34.06, down from ~70 on Oct 26 and now flat at 34.1 for two bars. Momentum is weak and approaching oversold (<30) but not there yet. [Bearish]
- 20 EMA (EMA 21): $65.92, with price at $61.62 about 6.5% below it. The EMA is rolling over and acts as overhead resistance. Price is also below the EMA 55 ($64.46) and SMA 50D ($64.96). [Bearish]
- MACD: Line -0.203 vs signal 0.758. The bearish crossover happened on Nov 6, and the histogram is deeply negative and expanding (about -0.96). Momentum is falling quickly. [Bearish]
- Bollinger Bands (20): Upper $71.68, lower $62.54. Price at $61.62 is below the lower band, which is a stretched, oversold reading after a sharp reversal from the upper band. Price is walking down, which is bearish, but a snap-back toward the mid-band is possible. [Bearish]
- CMF (20): -0.112, below the -0.05 threshold and sharply down from +0.30 on Oct 26. This is distribution, with heavy-volume selling in the last few sessions. [Distribution]
- ADX (14): 22.3 and rising, with +DI 13.8 and -DI 37.7. Bears are firmly in control. ADX is below 25, but the large DI spread shows a trend that is still building. [Moderate/Building Trend – Bearish]
- Volume: 41.49M. The sell-off bars on Nov 4-5 had the highest volume on the chart, which confirms distribution. The latest bar shows some stabilization. [Bearish – high-volume breakdown]
DIVERGENCES & TRENDS
- There is no bullish divergence yet. RSI and price are both making lower lows, and RSI is not yet below 30.
- Price made a higher high near $70 on Oct 30 while RSI peaked earlier (~70.8 on Oct 26). That was a mild bearish divergence which has since resolved to the downside.
- Price fell from $70.02 to $61.62 (-12%) in 5 sessions, losing the EMA 21, SMA 50D, EMA 55 and VWAP ($62.34) in one move.
- The MACD bearish cross, the −DI spike and the CMF flip to negative all confirm the breakdown.
- Price remains well above the rising SMA 200D ($58.58). The long-term trend is still up, and this level is the main downside magnet.
- The SMA 50D ($64.96) is above the SMA 200D, so there is no death cross. The EMA 21 is about to cross below the SMA 50D area, and the EMA 21/EMA 55 gap is narrowing quickly.
CHART PATTERNS
- The chart looks like a failed breakout at the Oct 30 high followed by a sharp rejection. It is closest to a Bearish Double Top / Triple Top structure. Highs formed near $69.3-70.0 over Oct 23-30, and the "neckline" near $66-67 has broken.
- A measured move from the ~$70 top to the ~$66.5 neckline projects roughly $63. That target has already been reached, and the extension points toward $59-60.
- Support from the Sep 22-Oct 2 base around $61 plus the SMA 200D at $58.58 gives a plausible landing zone.
- The pattern is not confirmed as a larger reversal. Price has not yet broken the Sep lows, so a bounce in a broader uptrend remains possible.
POTENTIAL SCENARIOS
- Scenario 1: Bearish Continuation Toward the 200-Day — Distribution and a bearish MACD cross lead to further downside as price fails to reclaim the VWAP and the 21/55 EMAs. Trigger: close below $60.80 (recent swing/low area). Target: $58.50-$59.50 (SMA 200D). Invalidation: daily close above $64.50 (EMA 55). (45% probability)
- Scenario 2: Neutral/Bearish Oversold Bounce Then Fade — RSI near 30 and a close below the lower Bollinger Band trigger a relief rally to $63-64.50 that stalls at the VWAP/EMA 55/SMA 50D cluster, then rolls over. Trigger: hold of $60.50 and a reclaim of $62.50. Target: $63.50-$64.50 before fading toward $61-$62. Invalidation: break below $59.50 early (Scenario 1) or close above $65 (Scenario 3). (35% probability)
- Scenario 3: Bullish V-Shaped Recovery — The sell-off was an overreaction. Price reclaims the EMA 21 and SMA 50D, which negates the double-top. Trigger: close above $65.90 on rising volume. Target: $67.50-$69. Invalidation: rejection at $64.50-$65 or a break below $60. (20% probability)
PRICE TARGETS
- Target Price: $60.40 (27-day outlook)
- Expected Range: $55.70 to $64.60 (width $8.90 = ~14.4% of the current price, consistent with the 30-60 day guidance and ATR-based volatility)
- Key Levels: Support at $58.58 (SMA 200D), Resistance at $62.34 (VWAP), with stronger resistance at $64.46 (EMA 55)
OVERALL BIAS
OVERALL BIAS: BEARISH - Price broke below the EMA 21, EMA 55, SMA 50D and VWAP on the heaviest volume of the chart. MACD has crossed down, CMF shows distribution, and −DI (37.7) dominates +DI (13.8). The most likely path is a drift toward the rising 200-day SMA near $58.60, with any oversold bounce capped by the $62.3-$64.5 resistance cluster.
This is educational analysis and not financial advice.