TSLA 27-day bearish forecast — Nov 8, 2026
- Bias: Bearish
- Timeframe: 27 days (made Nov 8, 2026, target date Dec 4, 2026)
- Price at analysis: $358.22
- Price target: $346.00
- Expected range: $322.00 – $376.00
- Result: Pending — graded after the close on Dec 4, 2026
Get a free AI analysis of TSLA today
Analysis
TECHNICAL INDICATORS
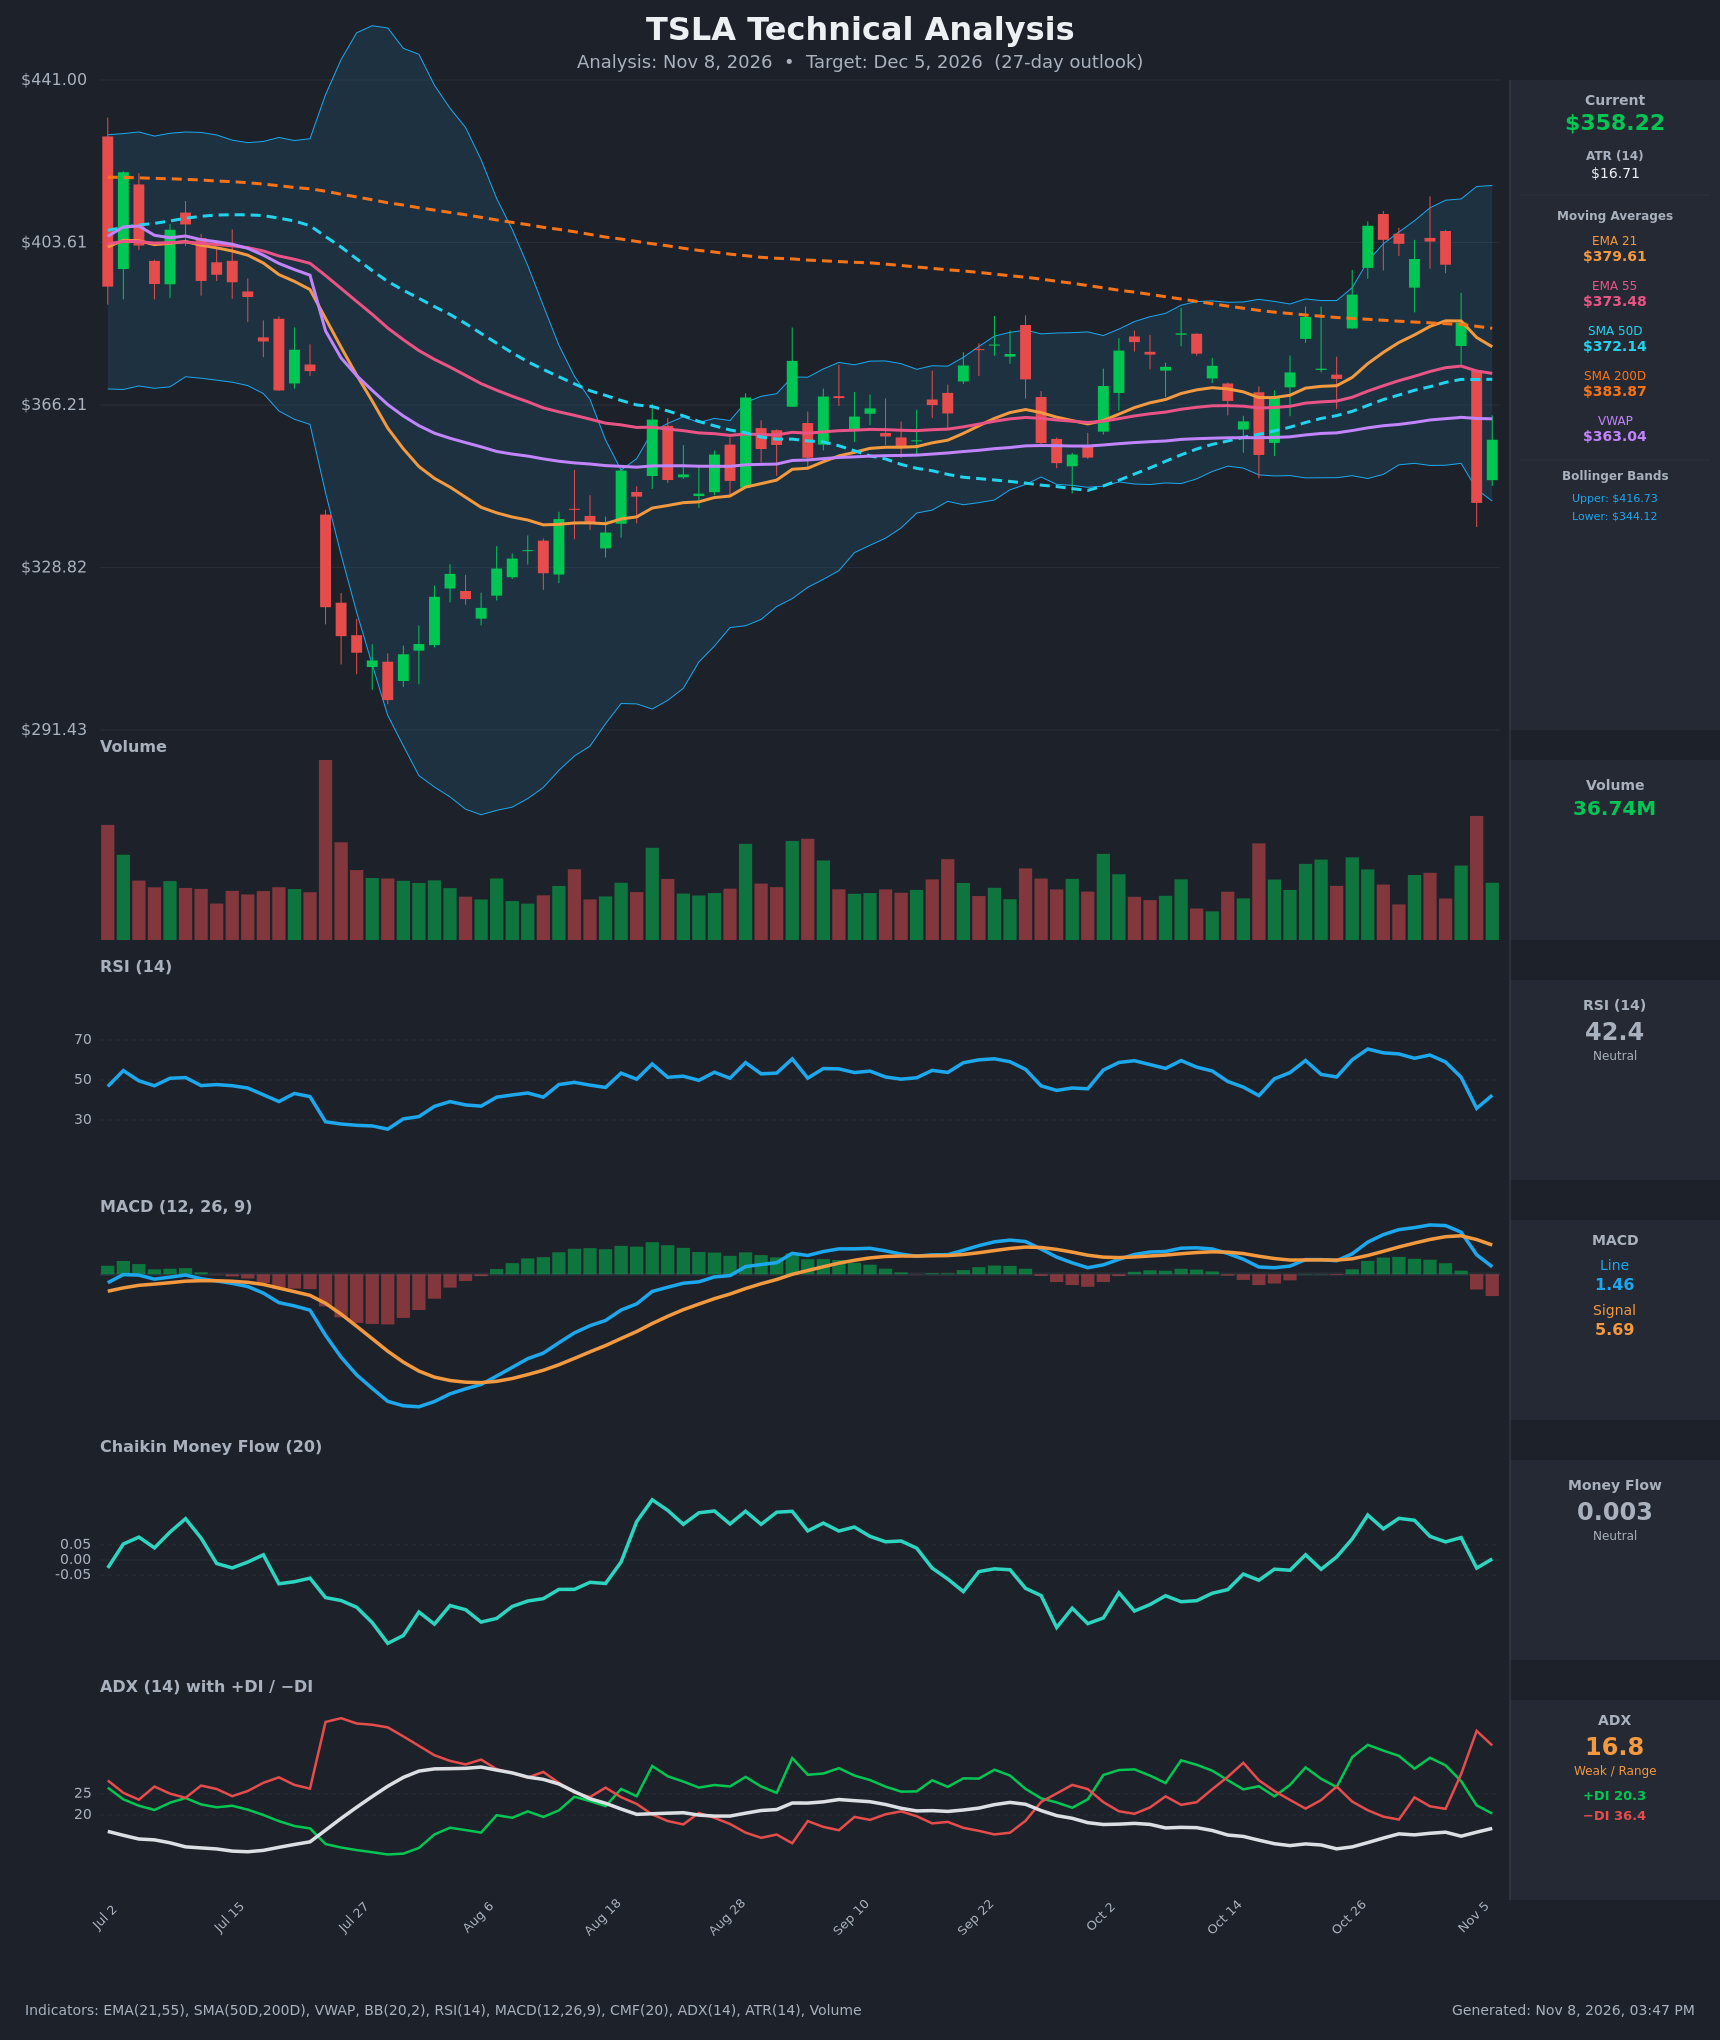
- RSI (14): 42.39. It fell from 65 in late October to a low near 36 on Nov 5, and has ticked up only slightly. It sits below the 50 midline but is not oversold, so there is room to fall further. [Bearish]
- 20 EMA: The supplied value is EMA 21 at $379.61, with price at $358.22 about 5.6% below it. EMA 21 is rolling over (it peaked at $385.59 on Nov 3), so it now acts as overhead resistance. EMA 55 ($373.48) is also above price. [Bearish]
- MACD: The line (1.46) is below the signal (5.69), with a negative and expanding histogram. The bearish crossover happened on Nov 5 after a run of rising readings. Both lines are still positive, so the damage is a momentum loss rather than a full trend reversal. [Bearish]
- Bollinger Bands (20): The bands run from $344.12 to $416.73, with a midline near $380. Price pierced the lower band on the Nov 5 flush, closing at $343.69 against a $344.12 lower band, then bounced back inside. The bands are fairly wide after the late-October rally. A band-walk lower would be bearish, but the bounce leaves it unresolved. [Neutral]
- CMF (20): 0.003, inside the ±0.05 neutral zone. It fell from +0.15 (Oct 27) to negative on Nov 5 and has barely recovered. Buying pressure has faded, but there is no real distribution yet. [Neutral]
- ADX (14): 16.8, below 20, so the trend is weak or range-bound. −DI (36.4) is far above +DI (20.3), after a bearish DI crossover on Nov 4–5. Sellers control direction, but trend strength is not yet confirmed. [Weak Trend, Bearish direction]
- Volume: 36.74M, with a heavy spike on the Nov 5 red candle and a lighter, below-average bounce on Nov 6. The breakdown came on stronger volume than the rebound, which is typical of distribution. [Bearish-leaning]
Other levels:
- Moving averages: Price is below EMA 21, EMA 55, SMA 50D ($372.14), SMA 200D ($383.87) and VWAP ($363.04). It is below the long-term trend line.
- SMA 200D: SMA 50D remains below SMA 200D, so there has been no golden cross.
DIVERGENCES & TRENDS
- There is no clean divergence. The RSI low on Nov 5 (~36) is a higher low than the July trough (~27), which is a mild long-term positive, but it does not signal an immediate reversal.
- MACD: The bearish crossover (Nov 5) and falling histogram show momentum rolling over from the late-October peak.
- DI crossover: Bearish. −DI jumped from 21 to 40 in two sessions, while ADX stays below 20, which suggests a sharp shock rather than an established downtrend.
- 200-day rejection: Price was rejected at the 200D SMA zone ($384–$388) and the upper band in late October, and has since lost the 21/55 EMAs and the 50D SMA.
- Recovery: The Nov 6 bounce (+4.2%) came on lighter volume and is still below the EMA/VWAP cluster at $363–$380.
CHART PATTERNS
- Rectangle / range (Bearish-leaning): Since mid-August, price has ranged between roughly $344 and $407. The Oct 27 high of ~$407 failed below the 200D SMA, and price has now returned to the bottom of the range. It resembles a Bearish Double Top (July highs ~$410 and the Oct 27 high ~$407). The lower boundary (~$344) is the neckline.
- Target: A confirmed break below ~$344 would give a measured move of about $60 (range height ~$63 down from $344), toward $285–$300. That is outside the 27-day base case unless support breaks decisively.
- Counter-view: The failure to close below $344 on Nov 5 and the bounce off the lower band keep a Bullish Triple Bottom / range alive. A reclaim of $373–$380 would neutralize the bearish setup.
POTENTIAL SCENARIOS
- Scenario 1: Bearish Lower-High Rollover and Range Support Test — Price fails at the VWAP/EMA 55/SMA 50 cluster ($363–$373), with −DI dominant and MACD staying below signal, and drifts back to test the $344 lower band and Nov 5 low. Trigger: rejection at $363–$373 and a close below $350. Target: $335–$346, with an extension to $322 if $344 breaks. Invalidation: daily close above $380 (EMA 21 and SMA 200D). (50% probability)
- Scenario 2: Neutral Range Chop — Weak ADX (<20) keeps price oscillating between support and the moving-average cluster as volatility contracts. Trigger: repeated closes between $345 and $375. Target: $350–$370. Invalidation: close below $343 or above $380. (22% probability)
- Scenario 3: Bullish Relief Rally and Reclaim — The lower-band bounce extends, RSI recovers above 50, and price retakes the EMAs and VWAP. Trigger: close above $373.50, then $380. Target: $390–$400, where the 200D SMA and the late-October highs sit. Invalidation: close back under $350. (28% probability)
PRICE TARGETS
- Target Price: $346.00 (27-day target)
- Expected Range: $322.00 to $376.00 (width $54.00 = ~15.1% of current price, in line with the 30-60 day guidance scaled for 27 days)
- Key Levels: Support at $343.69, Resistance at $373.48
OVERALL BIAS
OVERALL BIAS: BEARISH - Price is below every major moving average and VWAP, MACD has crossed bearish, −DI strongly leads +DI, and the Nov 5 breakdown came on heavy volume while the rebound was weaker. The weak ADX (16.8) and the lower-band bounce limit conviction, so a retest of the $344 range floor is the base case.
This is educational analysis and not financial advice.