WMT 27-day bullish forecast — Nov 8, 2026
- Bias: Bullish
- Timeframe: 27 days (made Nov 8, 2026, target date Dec 4, 2026)
- Price at analysis: $125.52
- Price target: $128.50
- Expected range: $117.50 – $136.00
- Result: Pending — graded after the close on Dec 4, 2026
Get a free AI analysis of WMT today
Analysis
TECHNICAL INDICATORS
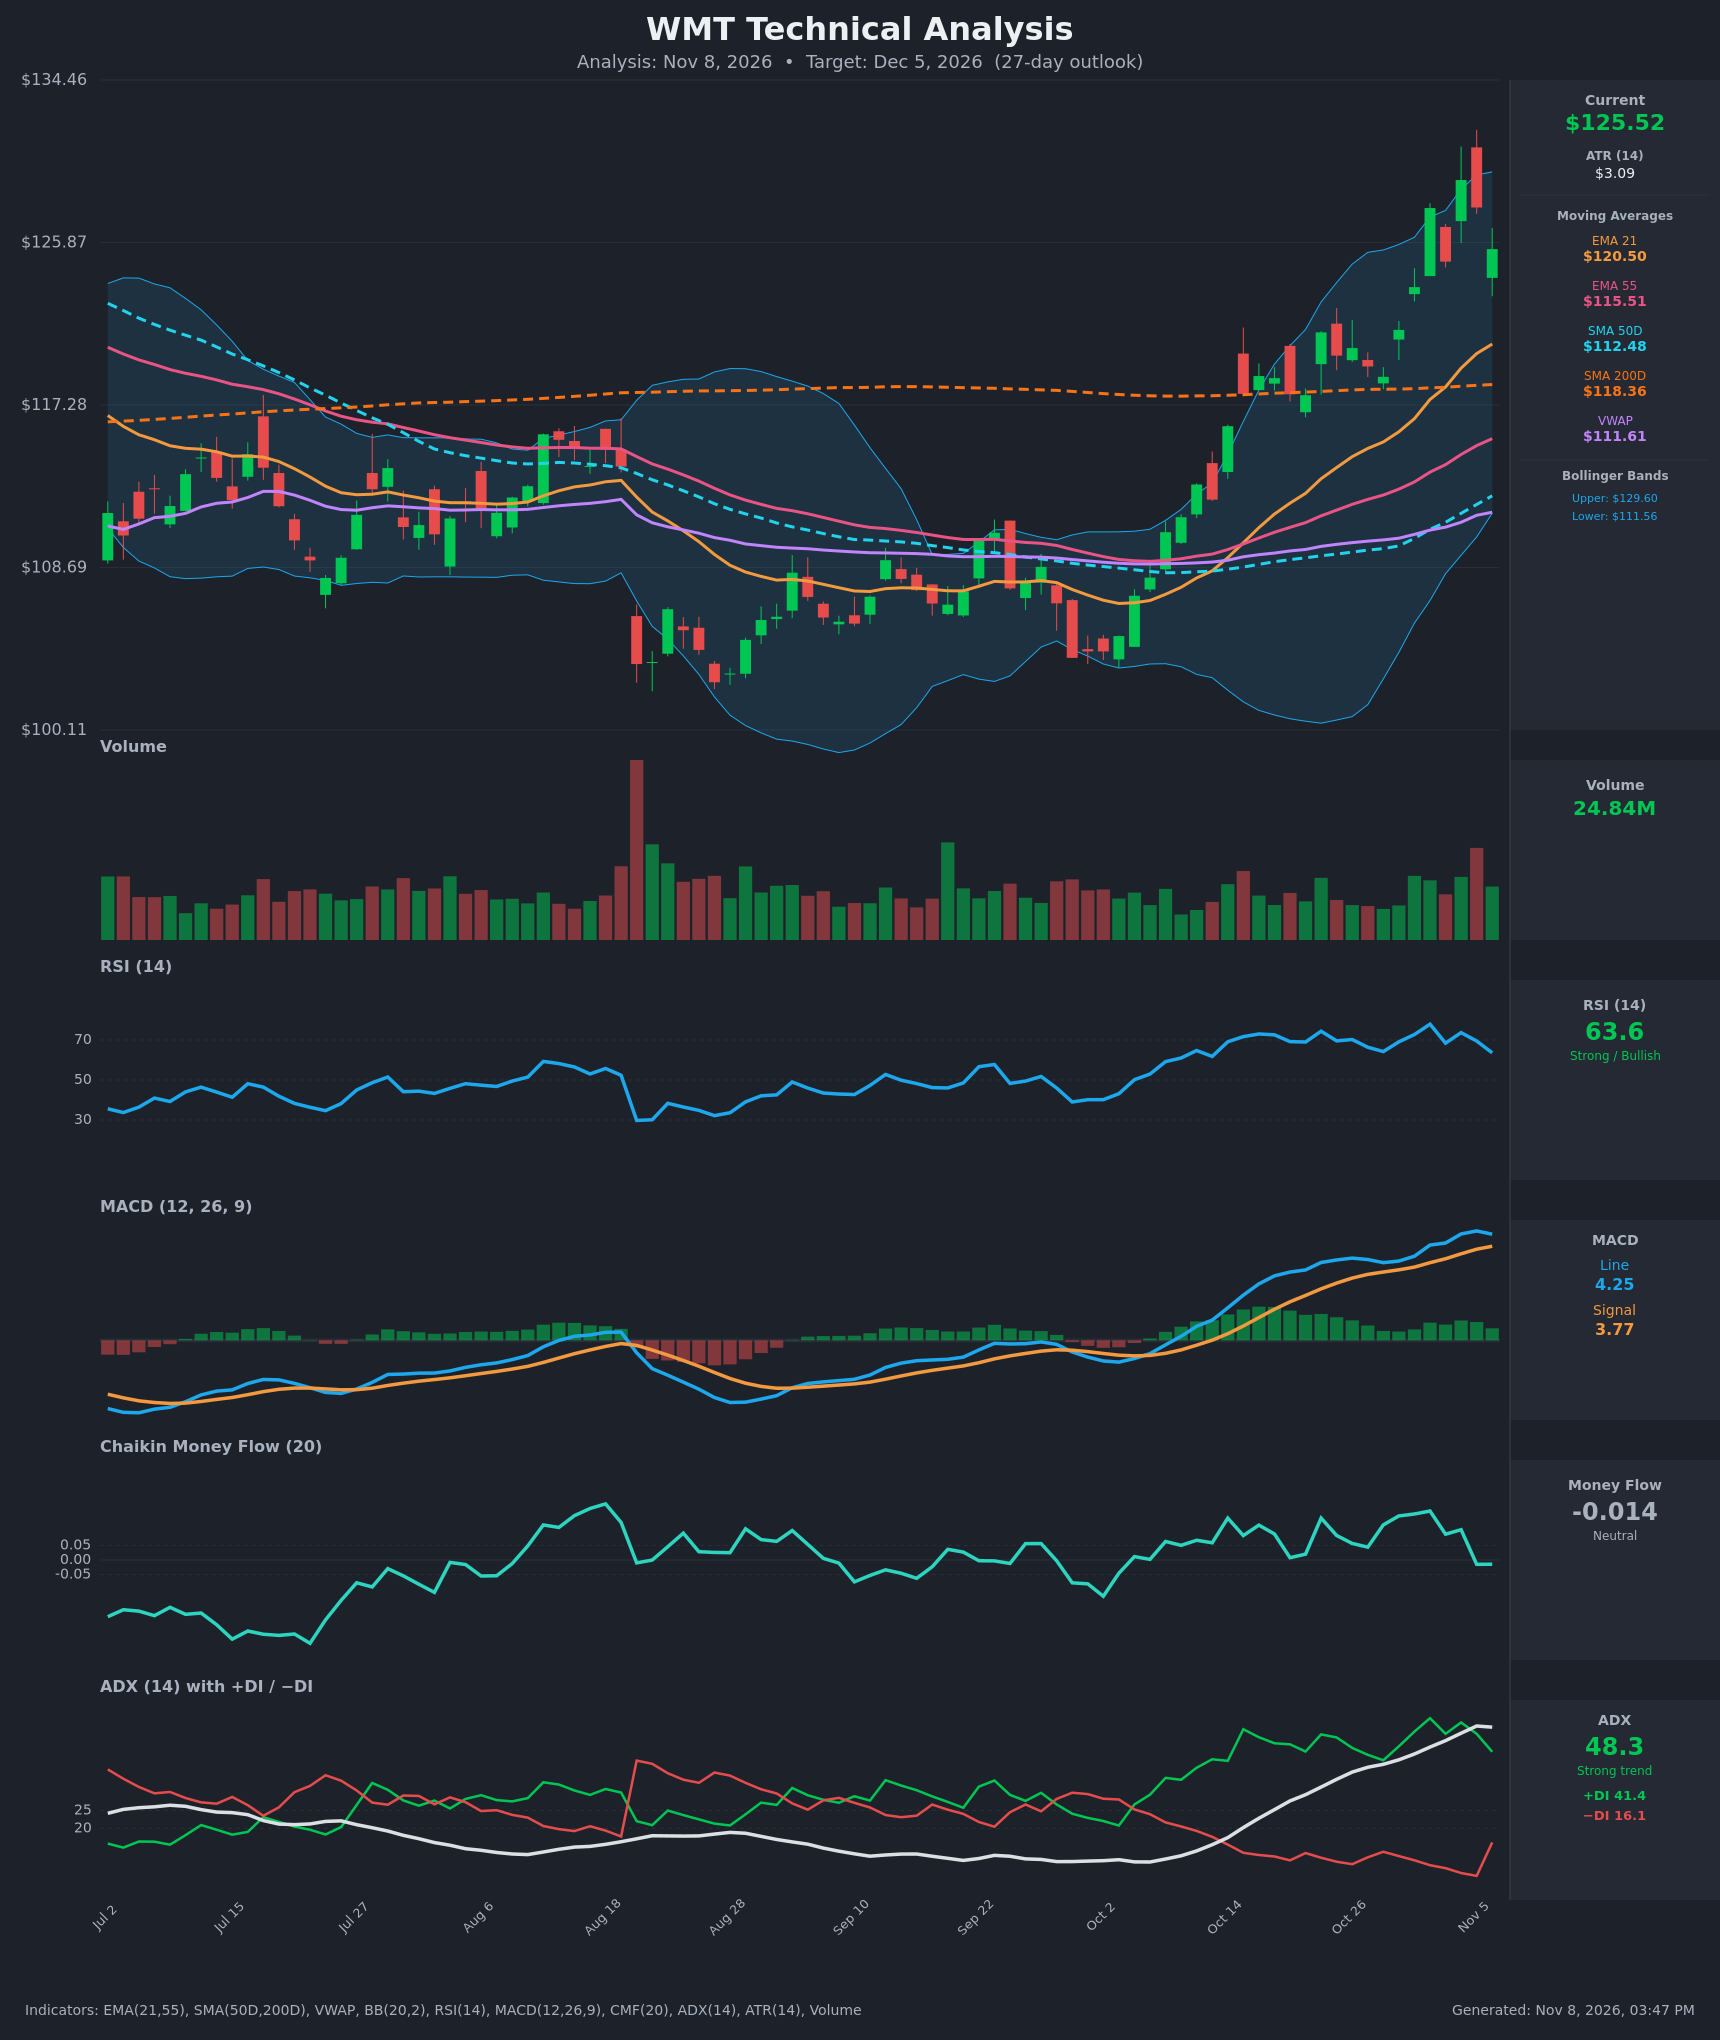
- RSI (14): 63.6, down from 77.9 on Nov 2 and 73.7 on Nov 4. It has made lower highs while price made higher highs, so momentum is cooling. It is out of overbought territory but still above 50. [Bullish]
- 20 EMA: The 21 EMA is $120.50 and price is $125.52, about 4% above it. The EMA has been rising steadily and is the first dynamic support. The 21 EMA is well above the 55 EMA ($115.51), a bullish stack. [Bullish]
- MACD: The line is 4.25 and the signal is 3.77, so the line is above the signal with a positive histogram of about +0.48. The histogram has shrunk from about +0.73 on Nov 4 and the line ticked down from 4.38, an early sign of momentum fading. There is no bearish crossover. [Bullish]
- Bollinger Bands (20): The bands are $111.56 to $129.60 and are wide and expanding. Price is in the upper half, about 78% of the way up the band, after tagging the upper band at $129.17 on Nov 4. The Nov 6 close was a pullback from the upper band. This is a walk-the-band uptrend, but it is stretched. [Bullish]
- CMF (20): -0.014 is inside the ±0.05 neutral zone and has slipped from +0.168 on Nov 2. Price is making new highs while money flow fades, a mild bearish divergence. [Neutral]
- ADX (14): 48.3 is a very strong trend, with +DI at 41.4 well above −DI at 16.1. ADX has plateaued (48.6 to 48.3), −DI jumped from 6.7 to 16.1 and +DI has fallen from 50.8. That often marks the late stage of a trend impulse. [Strong Trend – Bullish]
- Volume: 24.84M. Volume is heavy on the recent surge, and the large Nov 5–6 bars were on a red candle with an upper wick. That points to some supply or profit-taking near $129–131. [Neutral to slightly Bearish]
Other levels:
- VWAP and SMAs: VWAP is $111.61 and the SMA50 is $112.48. Price is above both, and well above the SMA200 ($118.36), so the long-term trend is up.
- Moving-average cross: The SMA50 is still below the SMA200, so there is no golden cross yet. The gap is closing (about $5.9), and a golden cross is possible within weeks if price holds.
DIVERGENCES & TRENDS
- Bearish divergence: Price made a higher high ($129.17 on Nov 4) while RSI peaked lower (77.9 on Nov 2, 73.7 on Nov 4) and CMF faded from +0.168 to -0.014.
- MACD: The histogram peaked on Nov 5 and is now contracting. The line is still above the signal, so there is no crossover. A cross would need roughly a 1.5–2 point drop in price over a few sessions.
- Trend: All MAs are rising or turning up. Price cleared the SMA200 in mid-October after a base, and the EMA21 and EMA55 crossed bullishly earlier. DI spread is wide, though −DI is rising from extreme lows.
- Overextension: Price is about 11.6% above the SMA50 and 6% above the SMA200. This stretch usually resolves with either a shallow pullback or sideways digestion.
CHART PATTERNS
- Bullish flag / pennant breakout (continuation): The Oct 14–22 consolidation at $117–121 sat right on the SMA200. It resolved upward in an impulse leg from about $118 to $129, a ~$11 move. A measured-move extension would target $130–$132.
- Possible short-term double top (reversal risk): Highs of $127.69 (Nov 2) and $129.17 (Nov 4), with a lower close on Nov 6, resemble an early double top. Confirmation needs a break below the Nov 3 low (about $124) and then ~$120. This is not yet confirmed. A confirmed break would target roughly $119–$121 (EMA21 / SMA200 zone).
- Overall: The dominant structure is an uptrend with a bullish continuation base, and there is a smaller topping risk near $129–$131.
POTENTIAL SCENARIOS
- Scenario 1: Bullish Trend Continuation After Shallow Pullback — Price digests the move, holds the $120.50–$123 zone (EMA21 and the prior breakout area), and resumes higher on the very strong ADX and positive MACD. Trigger: a daily close above $129.60 (upper Bollinger Band) or a bounce from $122–$124 on rising volume. Target: $130–$134. Invalidation: a daily close below $120. (45% probability)
- Scenario 2: Bearish Mean-Reversion Pullback — The RSI and CMF divergences, a possible double top at $129 and an extended price lead to profit-taking, with a drop toward the EMA21 and SMA200 cluster. Trigger: a close below $124, then below $122, plus a MACD bearish crossover. Target: $118–$120.50. Invalidation: a reclaim of $129.60 on strong volume. (35% probability)
- Scenario 3: Neutral Consolidation — Price chops between $121 and $130 while the MAs catch up and ADX cools. Trigger: ADX rolling over with RSI near 50–55 and no break of either extreme. Target: $123–$128. Invalidation: a close outside $120–$131. (20% probability)
PRICE TARGETS
- Target Price: $128.50 (27-day, modestly above the current $125.52 on trend persistence)
- Expected Range: $117.50 to $136.00 (width $18.50, about 14.7% of current price, within the 12–18% guidance for 30–60 days scaled to 27 days)
- Key Levels: Support at $120.50 (21 EMA; below that, $118.36 SMA200), Resistance at $129.60 (upper Bollinger Band; above that, the ~$131 recent swing high)
OVERALL BIAS
OVERALL BIAS: BULLISH - The trend is strong (ADX 48, +DI far above −DI, price above all key MAs, MACD above signal, a breakout above the SMA200), and a golden cross is approaching. Fading RSI and CMF and the high-volume rejection near $129 argue for a pullback along the way, so conviction is modest and a dip to $120–$123 is likely before the next leg.
This is educational analysis and not financial advice.