BAC 34-day bearish forecast — Nov 8, 2026
- Bias: Bearish
- Timeframe: 34 days (made Nov 8, 2026, target date Dec 11, 2026)
- Price at analysis: $49.42
- Price target: $47.30
- Expected range: $43.80 – $52.00
- Result: Pending — graded after the close on Dec 11, 2026
Get a free AI analysis of BAC today
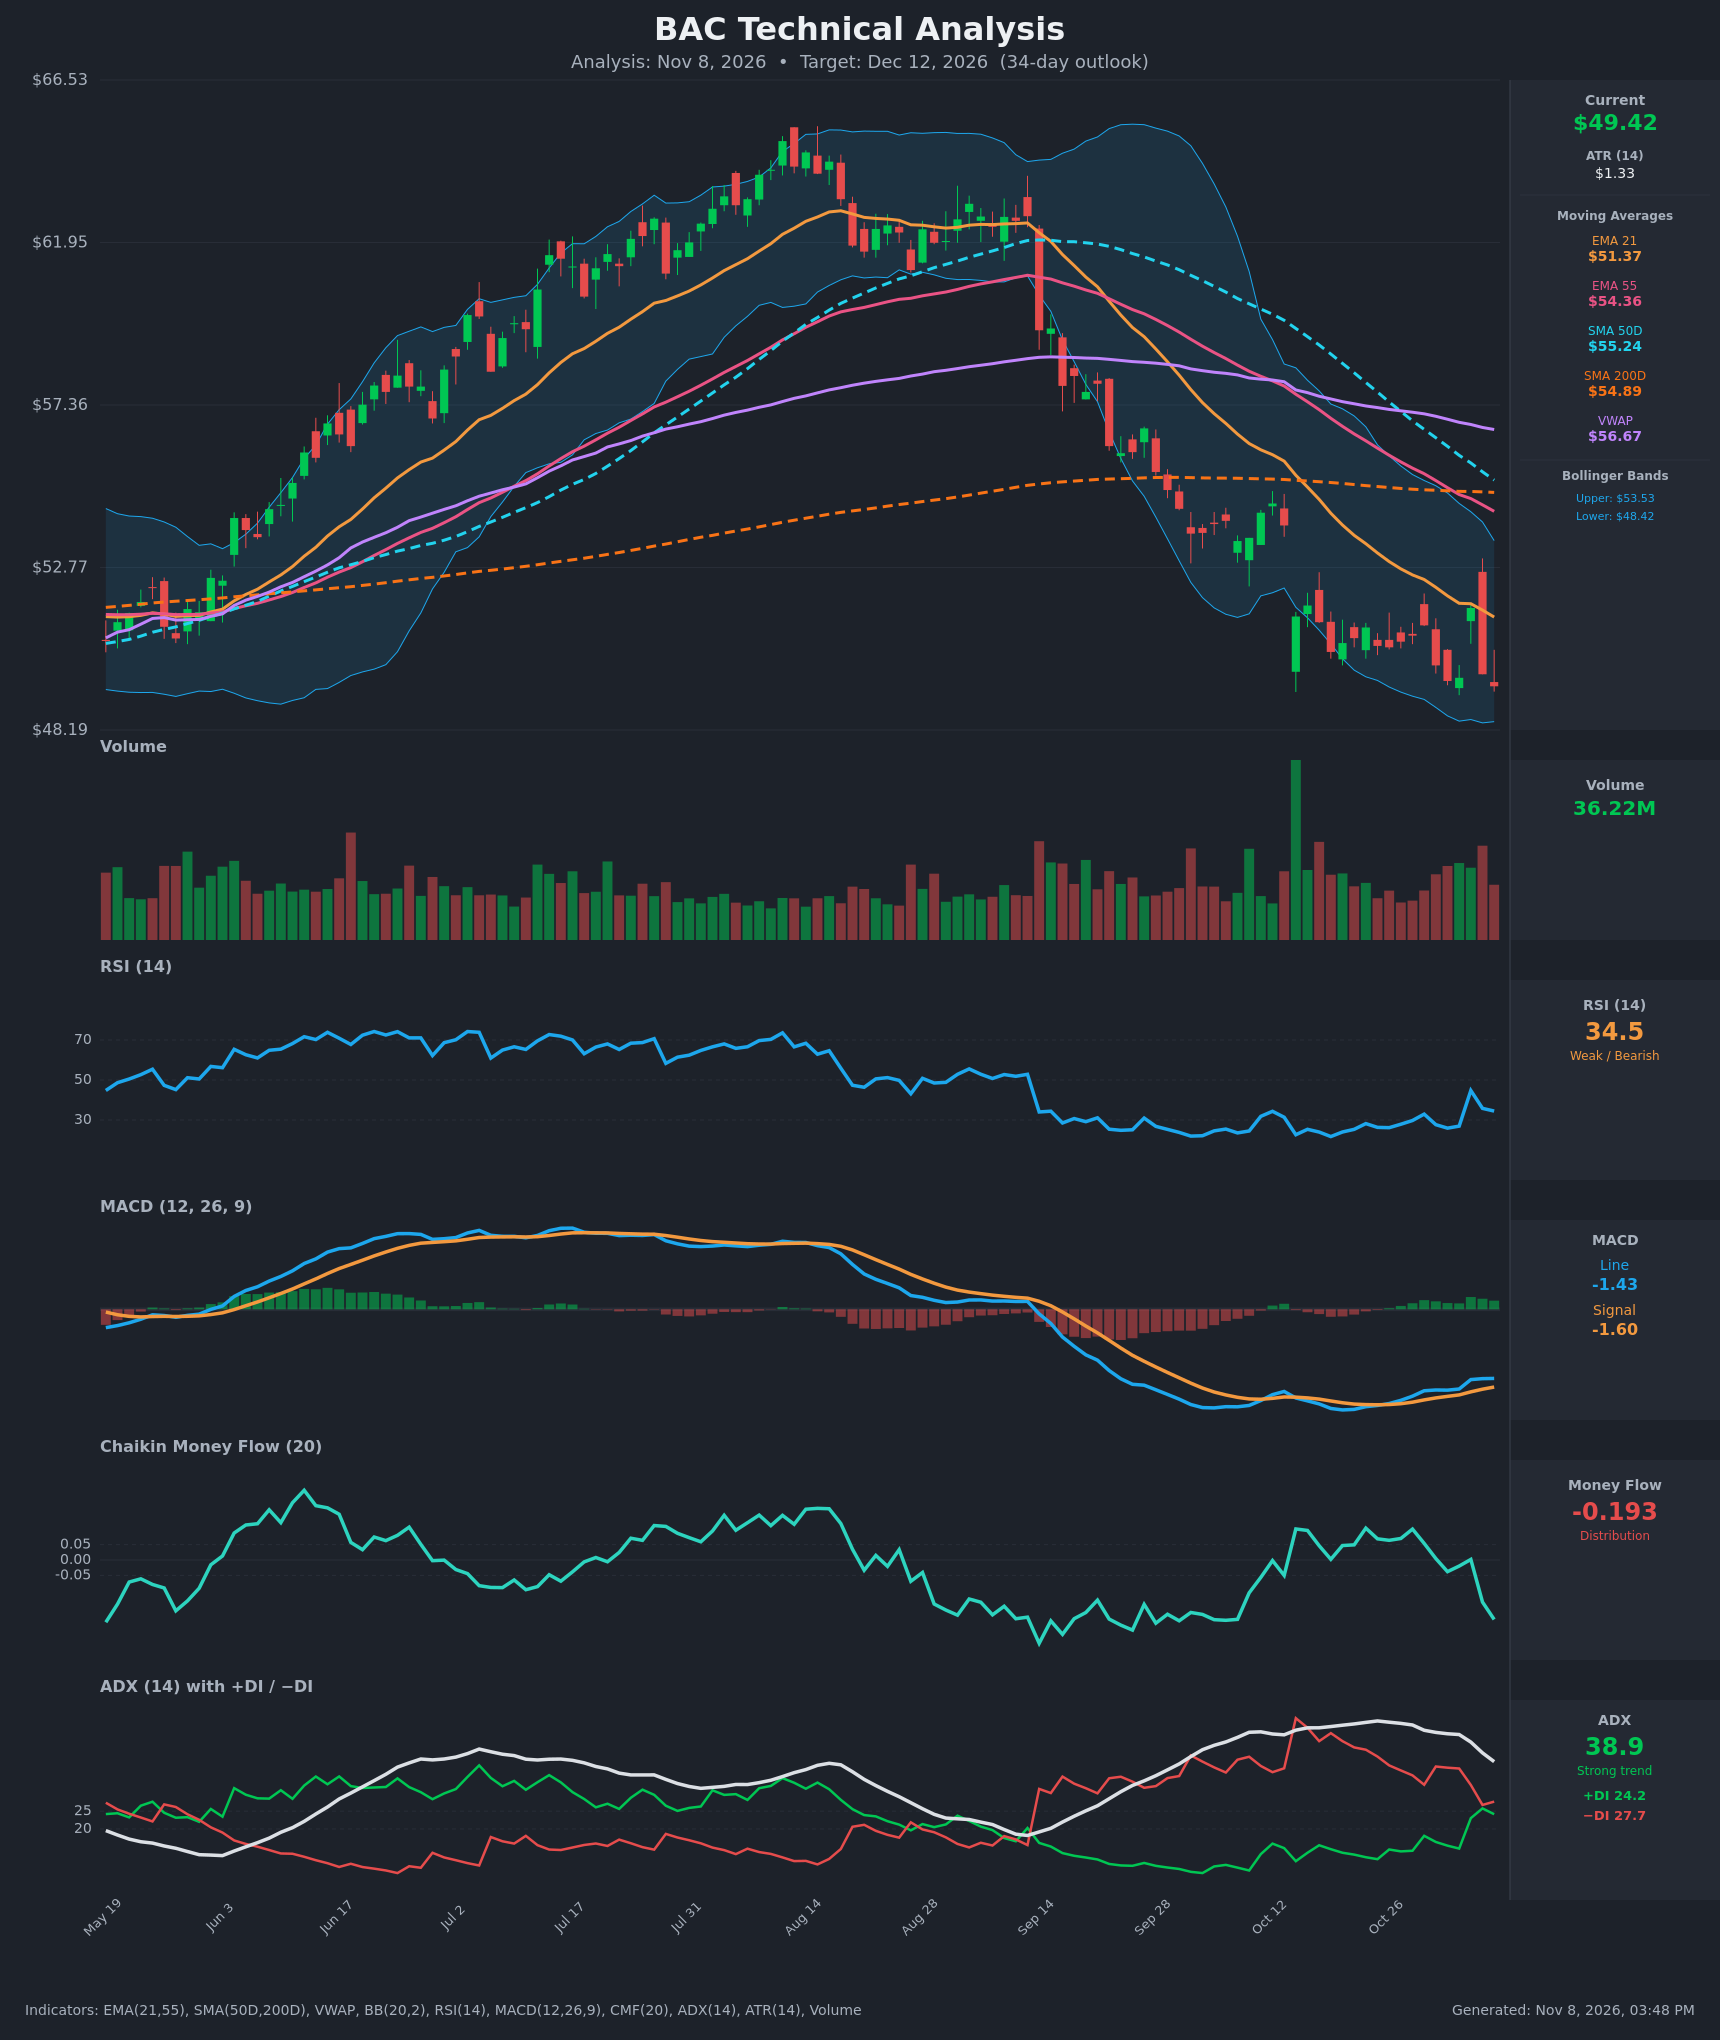
Analysis
TECHNICAL INDICATORS
- RSI (14): 34.47, below 50 and just above the 30 oversold line. It bounced from 21.7 on Oct 19 and is now rolling over from a spike to 44.7 on Nov 4. Price has made a lower low while RSI has not, which is a mild bullish divergence, but momentum is still weak. [Bearish]
- 20 EMA: The chart shows EMA 21 at $51.37, with EMA 55 at $54.36. Price at $49.42 is below both, and both are falling. The Nov 4 spike to $51.63 failed right at the EMA 21. EMA 21 is acting as dynamic resistance. [Bearish]
- MACD: Line -1.425 is above signal -1.603, so the histogram is slightly positive (+0.18) and has been improving since late October. Both lines are deep below zero, so this is only a weak momentum stabilization rather than a trend reversal. [Neutral]
- Bollinger Bands (20): Upper $53.53, lower $48.42. Price at $49.42 sits in the lower quarter of the band, about $1.00 above the lower band. The bands have narrowed from the September expansion, which suggests a volatility squeeze. Price has been walking the lower half since early October. [Bearish]
- CMF (20): -0.193, well below -0.05. It fell sharply from about +0.05 after the failed Nov 4 spike. That is clear distribution, meaning selling into strength. [Distribution]
- ADX (14): 38.9 and falling from a peak near 50, with -DI 27.7 above +DI 24.2. The trend is still strong and bearish, but it is fading and the DI gap has narrowed sharply (from 47 vs 14 on Oct 19). That points to a maturing downtrend and possible consolidation. [Strong Trend - Bearish, weakening]
- Volume: 36.22M, elevated relative to the recent average. The high-volume bars at the Nov 4 spike and recent red days show active selling, and the large capitulation bar in early October has not been reclaimed. [Selling pressure / Bearish]
Other moving averages and VWAP:
- Price is below SMA200D ($54.89) and SMA50D ($55.24), and VWAP is at $56.67.
- SMA50D is only about $0.35 above SMA200D and falling about $0.25 per day, so a death cross is imminent within days.
- This is a long-term downtrend structure.
DIVERGENCES & TRENDS
- Bullish RSI divergence (minor): Price made a new low at $49.42 versus $50.39 on Oct 19, while RSI is at 34.5 versus 21.7. This supports a relief bounce but needs confirmation.
- MACD: It crossed above its signal around Oct 23 while staying deeply negative. This is a weak, low-quality bullish crossover that has not lifted price.
- CMF: It has turned from slightly positive to -0.193, diverging bearishly from the sideways price. Money is leaving on bounces.
- ADX/DI: -DI is still above +DI after a near-cross on Nov 4. The downtrend is losing energy but has not been reversed.
- MA structure: EMA 21 < EMA 55 < SMA50D, with price under SMA200D. The SMA50/SMA200 death cross is about to complete. All averages are stacked bearishly above price.
- Rejection: The Nov 4 spike to $51.63 reversed fully the next day, a bearish rejection candle.
CHART PATTERNS
- Bearish Flag / Rectangle (continuation): After the sharp September drop from roughly $62 to $51, price has consolidated between about $49.4 and $51.6 since early October. This is a classic pause within a downtrend. The Nov 4 failure at the top of the range and the new low at $49.42 favor a downside resolution.
- Target: A full measured move would be extreme (around $40). I use only part of it, because the support near $48.4 and the oversold readings argue for a slower decline.
- Invalidation: A close back above $51.6–$52 (the EMA 21 area and range top) would negate the pattern and open a squeeze toward $53.5.
- Alternative: The RSI divergence and band squeeze leave a bullish falling-wedge-like reversal possible, but that is not confirmed.
POTENTIAL SCENARIOS
- Scenario 1: Bearish Range Breakdown / Flag Continuation — Price loses the $48.4 lower Bollinger Band and the bottom of the multi-week range as distribution continues, and the death cross adds pressure. Trigger: daily close below $48.40 on above-average volume. Target: $46.50–$47.50, with an extension to $45.00. Invalidation: daily close above $51.65. (50% probability)
- Scenario 2: Bullish Oversold Relief Bounce — The RSI divergence and positive MACD histogram produce a mean-reversion rally back toward falling resistance. Trigger: close above $51.40 with CMF turning positive. Target: $53.00–$53.50 (upper band, falling SMA50D/EMA 55 zone). Invalidation: close below $48.40. (32% probability)
- Scenario 3: Neutral Continued Consolidation — Price chops inside $48.5–$51.5 as ADX decays and the bands squeeze. Trigger: failure to close outside the range. Target: $49.00–$51.00. Invalidation: a daily close outside $48.40–$51.65. (18% probability)
PRICE TARGETS
- Target Price: $47.30 (34-day target, about -4.3%)
- Expected Range: $43.80 to $52.00. Width is $8.20, or about 16.6% of the current price, which fits the 30–60 day guidance of 12–18%.
- Key Levels: Support at $48.42 (lower Bollinger Band, then $46.50), Resistance at $51.63 (Nov 4 swing high, with EMA 21 at $51.37 just below)
OVERALL BIAS
OVERALL BIAS: BEARISH - Price is below all key moving averages with an imminent death cross, CMF at -0.193 shows distribution, −DI leads with ADX still near 39, and the consolidation looks like a bearish flag that was rejected at the EMA 21. The oversold RSI divergence and positive MACD histogram argue for bounces, so conviction is modest.
This is educational analysis and not financial advice.