BB 34-day bullish forecast — Nov 8, 2026
- Bias: Bullish
- Timeframe: 34 days (made Nov 8, 2026, target date Dec 11, 2026)
- Price at analysis: $8.74
- Price target: $9.05
- Expected range: $8.00 – $9.45
- Result: Pending — graded after the close on Dec 11, 2026
Get a free AI analysis of BB today
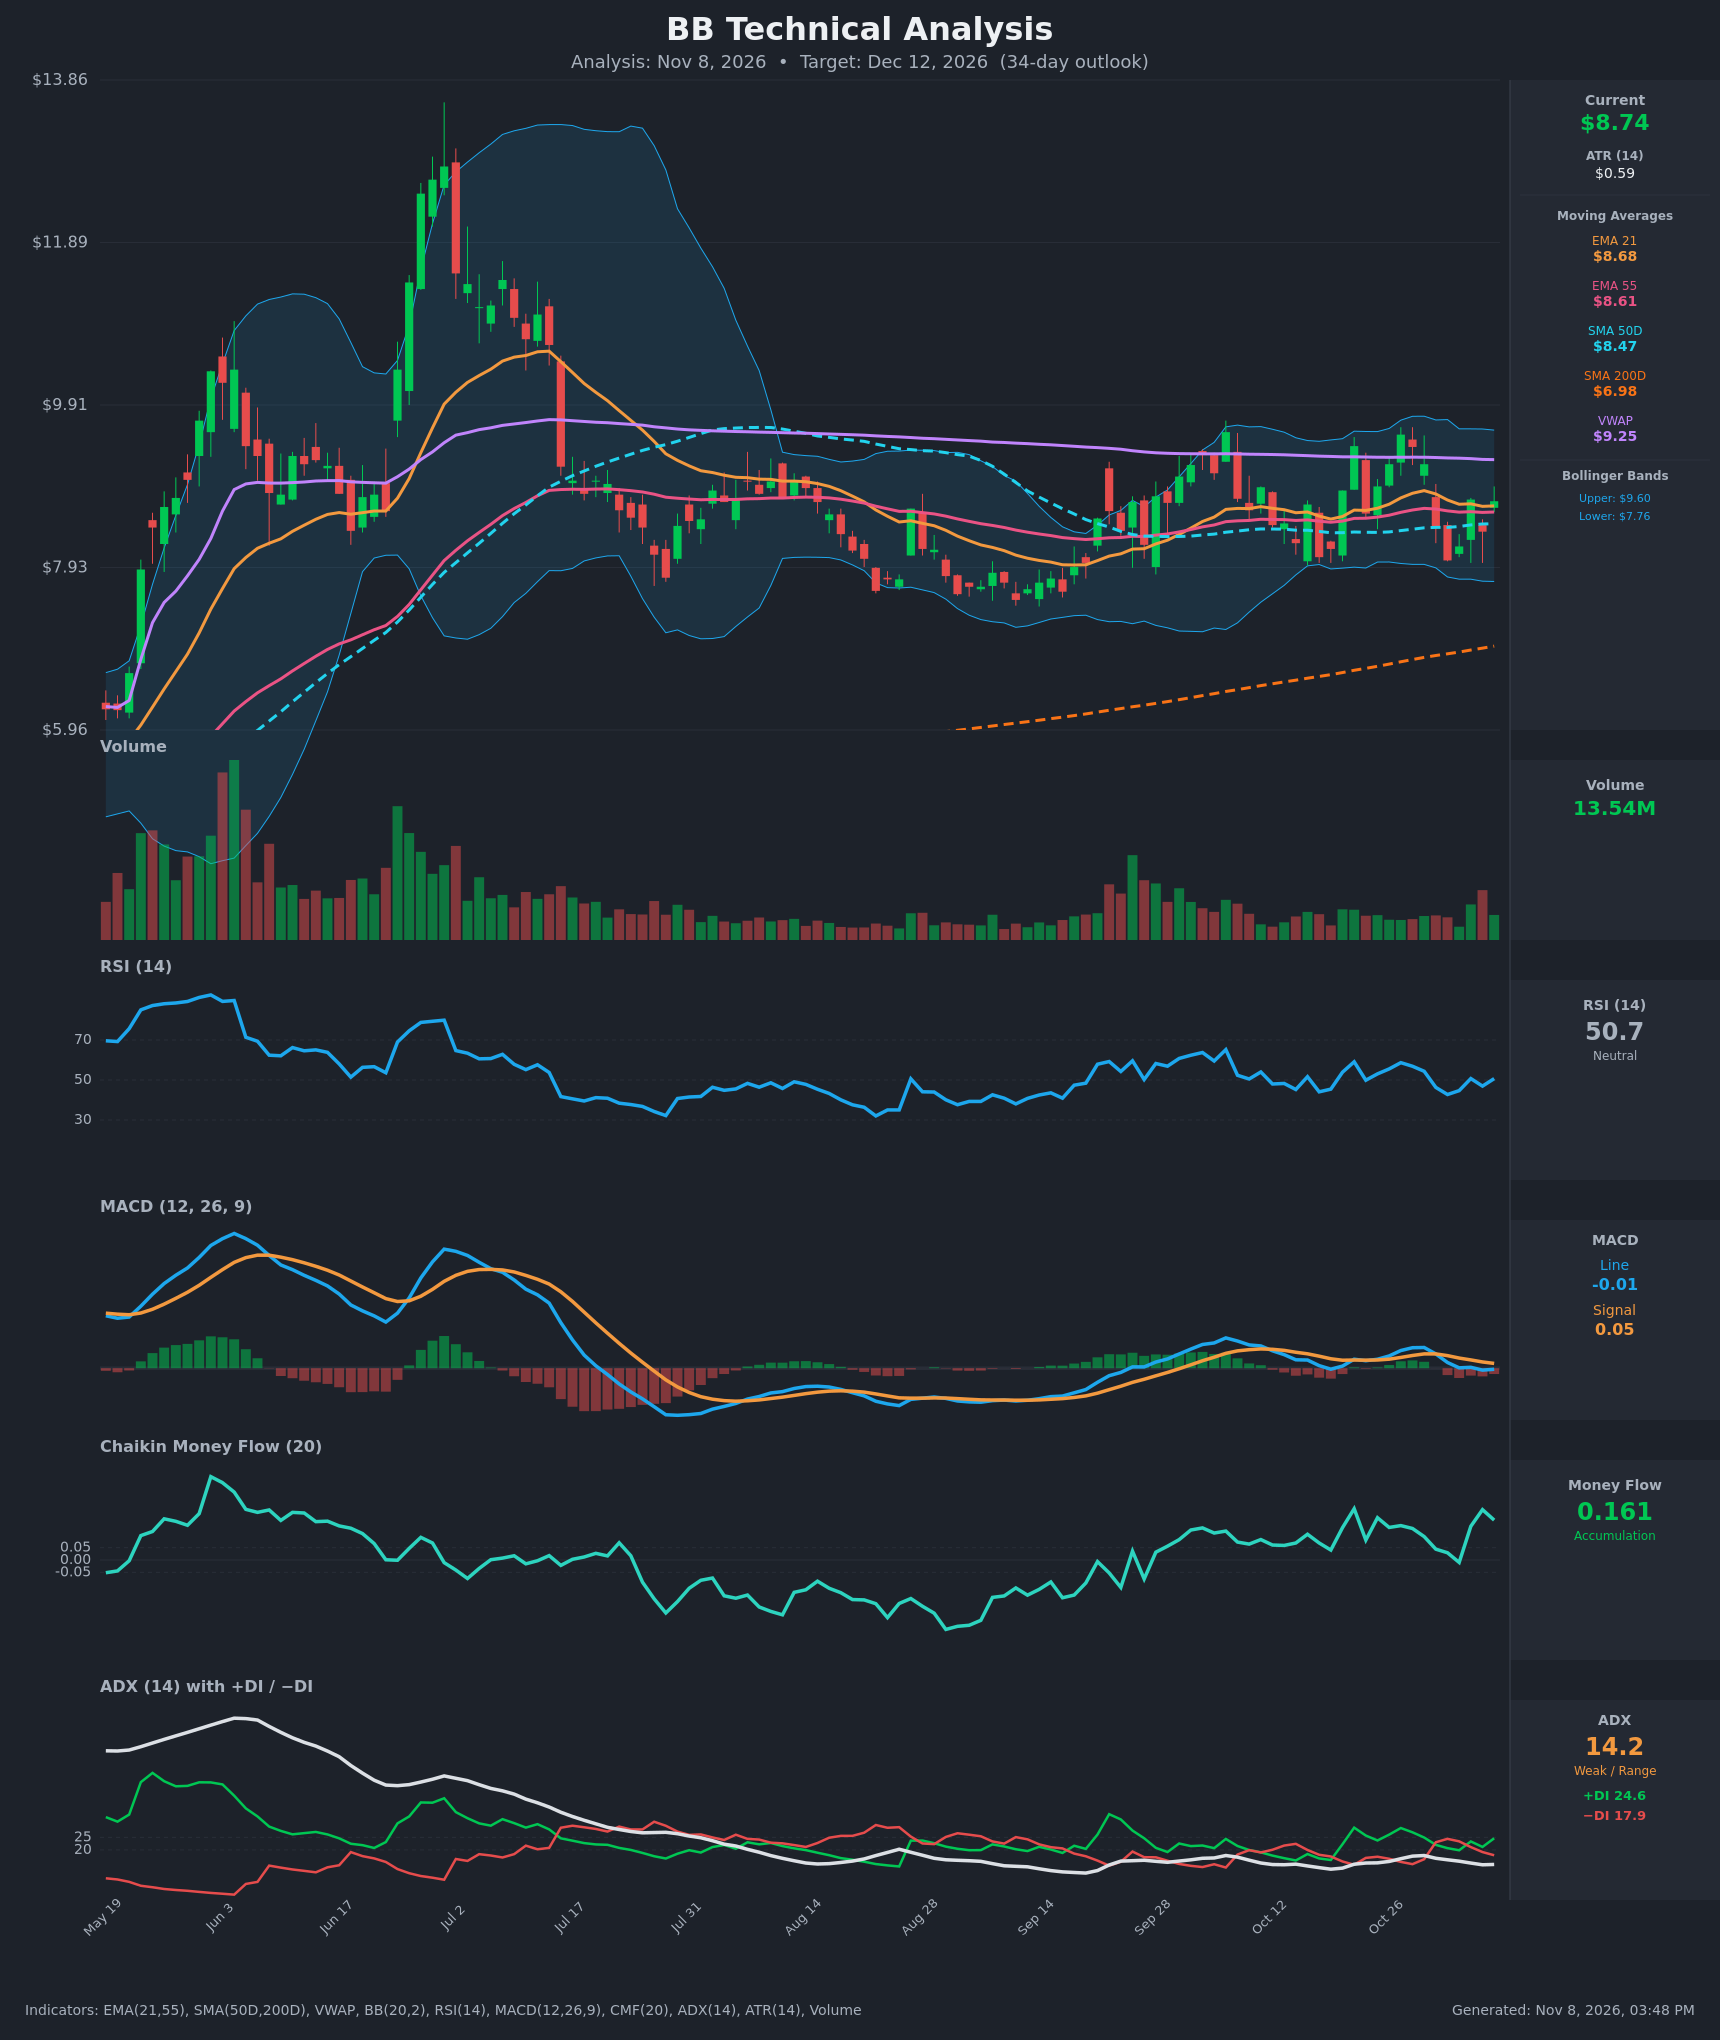
Analysis
TECHNICAL INDICATORS
- RSI (14): 50.69, dead center of the range. It has oscillated between about 43 and 59 for the last 15 bars with no trend. Momentum is flat. [Neutral]
- 20 EMA: The EMA 21 is $8.68 and price ($8.74) sits just above it, so it acts as marginal support. EMA21 is above EMA55 ($8.61), a mild bullish stack, but the gap is only about $0.07. [Bullish]
- MACD: The line is -0.010 against a signal of 0.046, so it is below the signal after a bearish crossover around Oct 30. The histogram is slightly negative (about -0.056) but narrowing from -0.078. The line sits near zero, which shows momentum fading, not a bearish trend. [Bearish]
- Bollinger Bands (20): Upper $9.60, lower $7.76, middle about $8.68. Price is mid-band, with the bands moderately wide and flat. There is no squeeze and no band-walk. The Oct 27 high of $9.55 tagged the upper band and was rejected. [Neutral]
- CMF (20): 0.161, well above +0.05 and positive for most of the last 15 bars. This is steady buying pressure and accumulation even while price chops sideways. [Accumulation]
- ADX (14): 14.2, below 20, so the trend is weak and the market is range-bound. +DI (24.6) is above −DI (17.9), so bulls have a modest edge. [Weak Trend + Bullish lean]
- Volume: 13.54M, an uptick from the quiet summer sessions but not a breakout surge. Volume has been subdued since August, which fits consolidation. [Neutral / slightly supportive]
Other context:
- SMA 50D / 200D: Price is above the SMA50 ($8.47) and well above the rising SMA200 ($6.98), so the long-term trend is up. SMA50 is above SMA200, so the golden-cross structure is intact. [Bullish]
- VWAP: $9.25, above price. It acts as overhead resistance, and price has traded below it since August. [Bearish]
DIVERGENCES & TRENDS
- CMF vs. price: CMF has trended higher since August (from about -0.15 to +0.16) while price has only gone sideways. That is a mild bullish divergence, with accumulation underneath a flat tape.
- MACD vs. price: The MACD bearish crossover is the main caution. The line is hovering around zero, so it signals a pause more than a reversal.
- RSI: It has held above 40 since September, a higher floor than the 30–35 lows of July–August. That suggests the downtrend momentum has faded.
- Moving averages: EMA21 and EMA55 are compressing together with price, which marks an indecisive coil. SMA50 has turned upward after flattening in the late summer.
- ADX/DI: ADX is near its lows (14), with no trend. The +DI/−DI whipsaw shows bulls and bears trading control within the range.
- Higher lows: Price has made a series of higher lows since the late-August base near $7.6–7.8.
CHART PATTERNS
- Rectangle / range consolidation (closest to the Bullish Triple Top diagram): Since September, price has oscillated between roughly $8.00–8.20 (Oct 19 and Nov 2 lows) and $9.40–9.55 (Oct 21 and Oct 27 highs). Because of the higher lows since August, this looks like a basing structure, with the ascending-triangle shape partially forming (flat resistance near $9.5, rising support).
- Significance and target: An ascending-triangle-style breakout above $9.55 on volume would project roughly $10.5–11.0, using the range height of about $1.5 added to the breakout. The risk is that the double tag of $9.4–9.55 reads as a Bearish Double Top, which would break down through $8.0 toward $7.6–7.7.
- Confirmation: No pattern is confirmed yet. Low ADX means a breakout is not imminent, so a 34-day target should be moderate.
POTENTIAL SCENARIOS
- Scenario 1: Bullish Range Upside Grind — Accumulation (CMF +0.16), price above all moving averages and the rising SMA200, and +DI over −DI favor a drift toward the upper range. Trigger: a daily close above VWAP ($9.25) with MACD recrossing above signal. Target: $9.50–$9.60, with an extension to $10.50 on a confirmed breakout. Invalidation: a daily close below $8.40 (SMA50 area). (45% probability)
- Scenario 2: Neutral Continued Chop — ADX stays below 20 and price keeps oscillating between $8.0 and $9.4 around the EMAs. Trigger: failure at VWAP with support holding at the SMA50. Target: $8.40–$9.10. Invalidation: a close outside $8.00–$9.55. (30% probability)
- Scenario 3: Bearish Range Breakdown — The MACD bearish crossover and VWAP rejection lead to a double-top failure and a breakdown. Trigger: a close below $8.47 and then $8.00. Target: $7.75 (lower Bollinger Band) and then $7.60. Invalidation: a reclaim of $9.25. (25% probability)
PRICE TARGETS
For the 34-day horizon (to Dec 12, 2026):
- Target Price: $9.05
- Expected Range: $8.00 to $9.45 (width $1.45, about 16.6% of the current price, consistent with the 12–18% guidance for 30–60 days)
- Key Levels: Support at $8.47 (SMA50), Resistance at $9.25 (VWAP), with further resistance at $9.55
OVERALL BIAS
OVERALL BIAS: BULLISH - Price is above the EMAs, the SMA50 and the rising SMA200. CMF shows sustained accumulation, +DI leads −DI, and the higher lows since August point to a modest upside drift. The bias is held with modest conviction because ADX is weak, VWAP overhead is resistance, and MACD has crossed bearish.
This is educational analysis and not financial advice.