IWM 34-day bearish forecast — Nov 8, 2026
- Bias: Bearish
- Timeframe: 34 days (made Nov 8, 2026, target date Dec 11, 2026)
- Price at analysis: $273.67
- Price target: $267.00
- Expected range: $248.00 – $289.00
- Result: Pending — graded after the close on Dec 11, 2026
Get a free AI analysis of IWM today
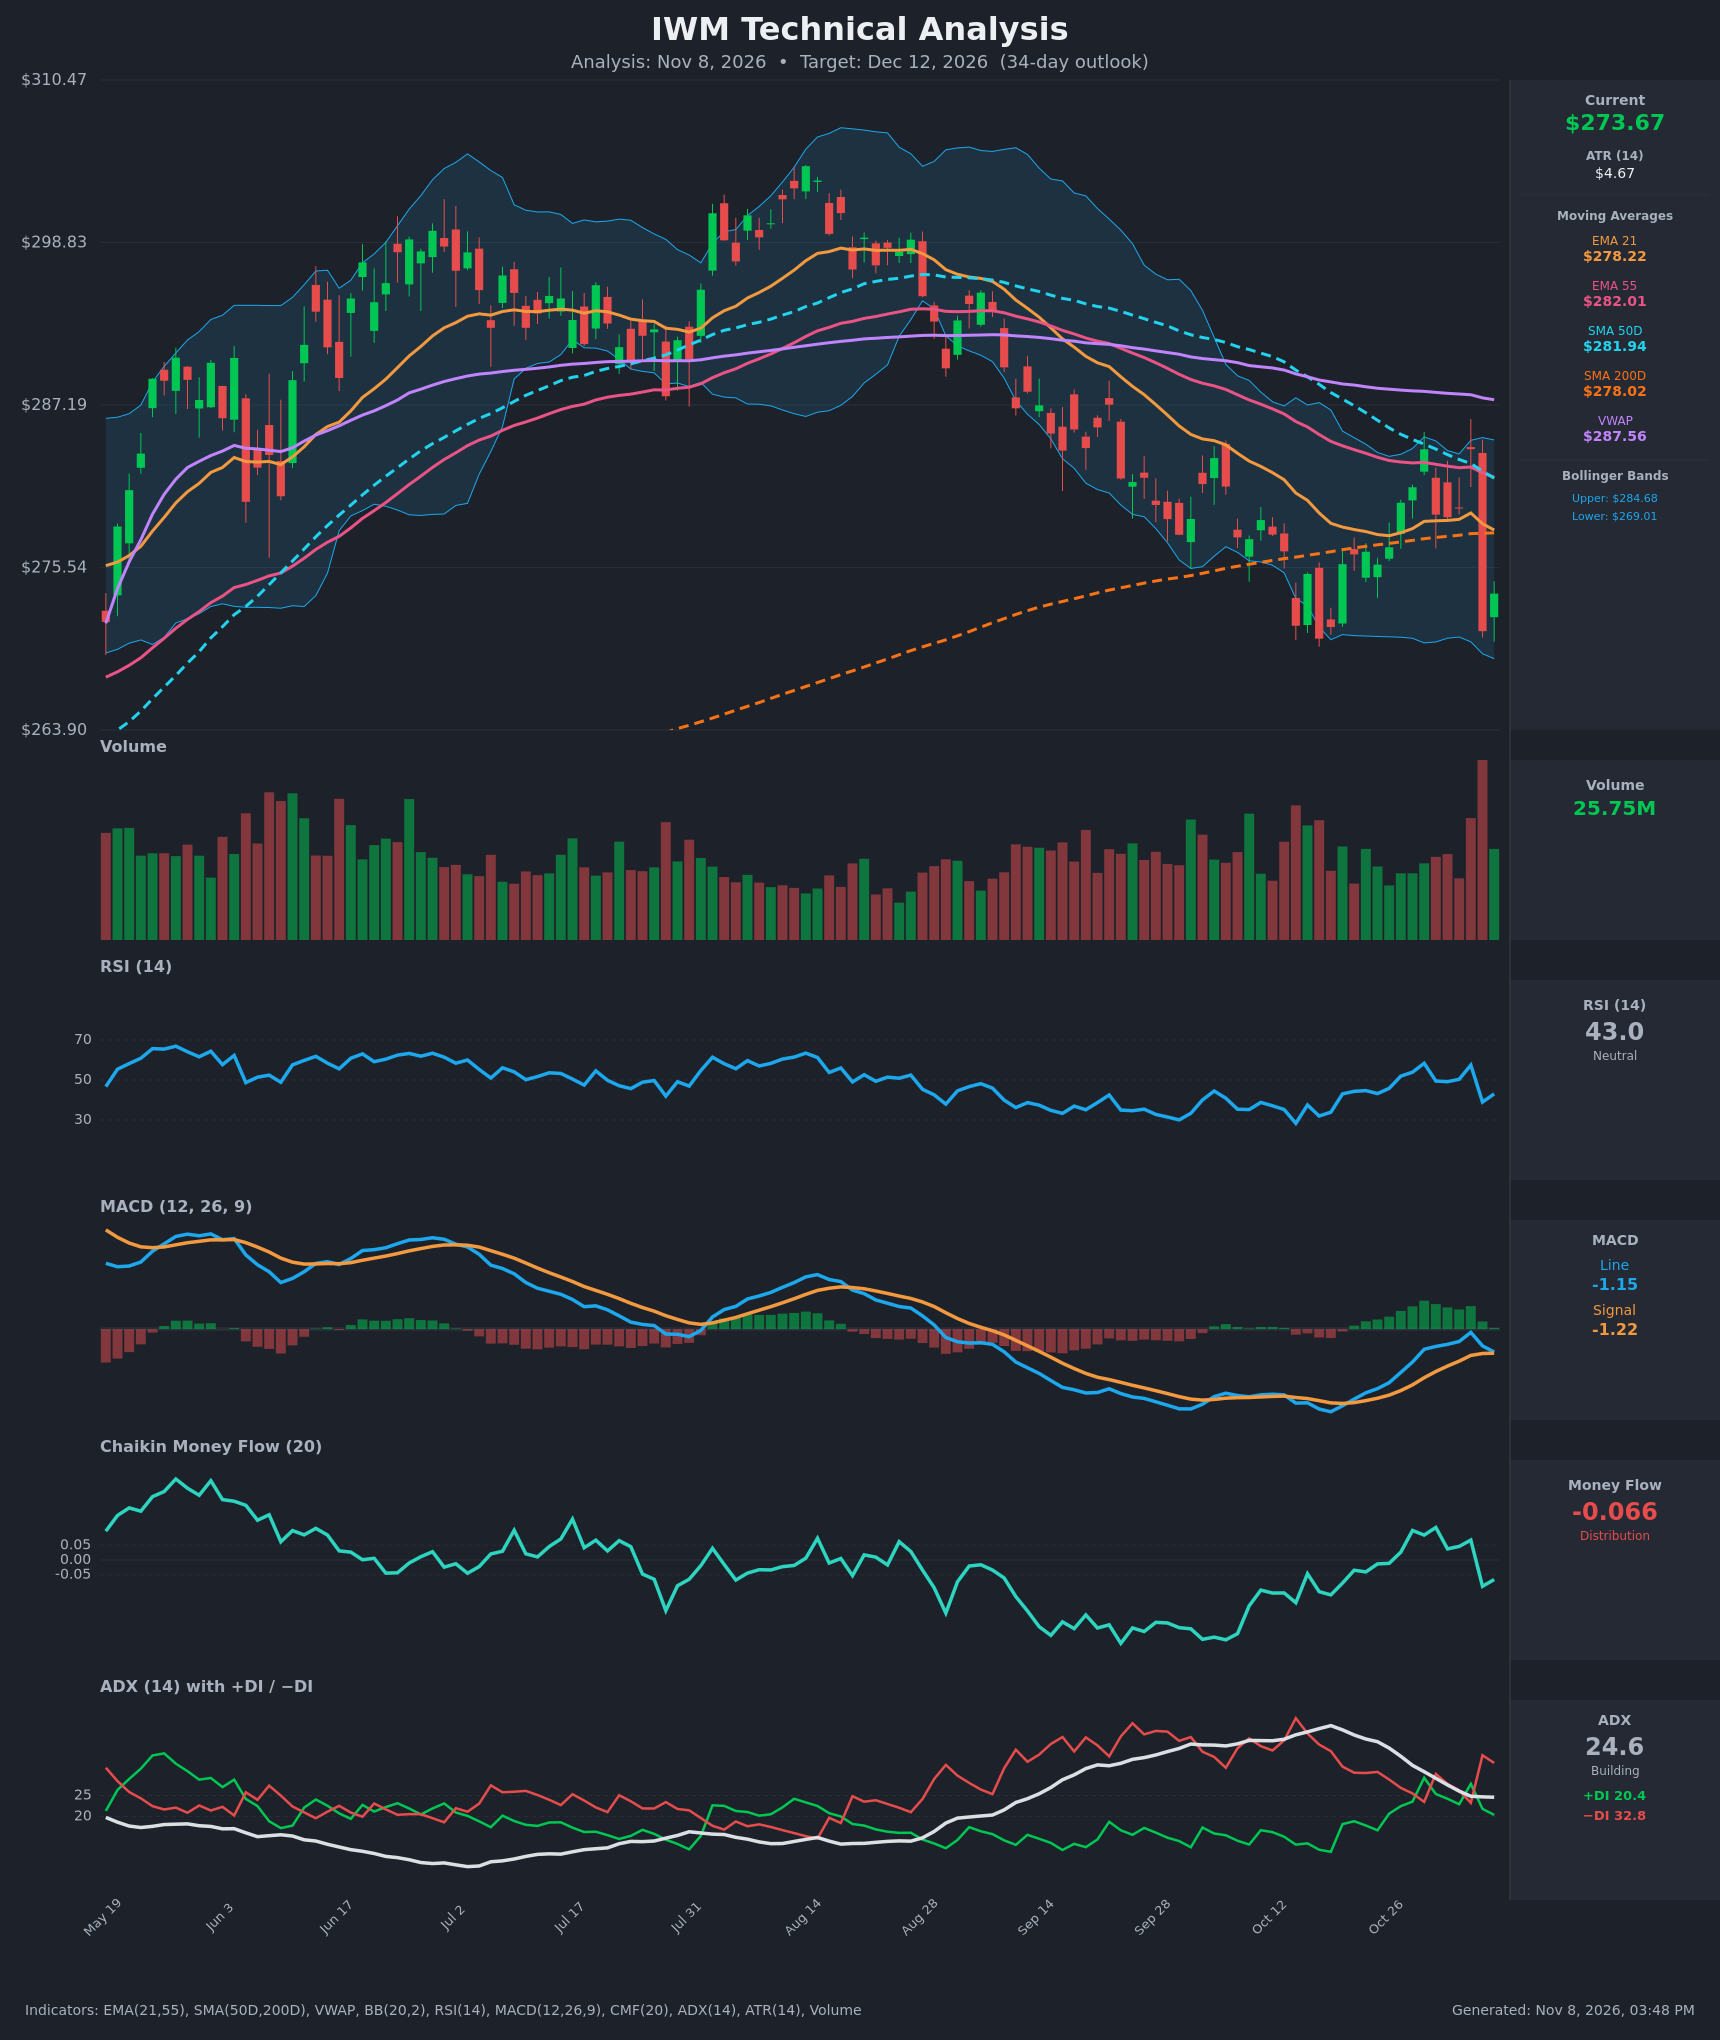
Analysis
TECHNICAL INDICATORS
- RSI (14): 43.05, below the 50 midline but well above oversold. It dropped from 57.5 to 39.0 in one session on Nov 5 and has bounced only slightly. The failure to hold above 50 (peak of 58 on Oct 29) shows momentum rolling over. [Bearish]
- 20 EMA (EMA 21): $278.22. Price at $273.67 is about 1.6% below it, so the EMA now acts as resistance. EMA21 is also below EMA55 ($282.01), so the bearish stack is intact. [Bearish]
- MACD: Line -1.155 vs signal -1.216, so the histogram is barely positive (+0.06) and collapsing. The line peaked at -0.17 on Nov 4 and has turned down for two sessions. Both lines are below zero, and a bearish crossover looks imminent. [Bearish]
- Bollinger Bands (20): Upper $284.68, lower $269.01, midline about $276.84. Price is in the lower half of the bands. The Nov 5 candle fell from the upper band area to near the lower band, a sharp rejection. The lower band at about $269 matches the October swing lows and is the key support test. [Bearish]
- CMF (20): -0.066, below the -0.05 threshold and flipped from +0.068 on Nov 4 to -0.089 on Nov 5. This is distribution after a brief, weak accumulation spell (+0.03 to +0.11). [Distribution]
- ADX (14): 24.6 with −DI 32.8 above +DI 20.4. ADX is fading from 41.7 but is still near trend-strength territory. Sellers hold a 12-point DI edge, and the −DI/+DI spread widened again on Nov 5. This is a moderate bearish trend. [Moderate Trend – Bearish]
- Volume: 25.75M on the latest (green, bounce) bar, which is modest. The Nov 5 red candle had the heaviest volume on the chart, a high-volume bearish engulfing. The bounce has not been backed by comparable volume. [Bearish – heavy-volume selloff, light-volume bounce]
DIVERGENCES & TRENDS
- Price vs. VWAP and moving averages: Price is below VWAP ($287.56, about 5% above), EMA21, EMA55, SMA50D ($281.94) and now SMA200D ($278.02). Losing the long-term average is a meaningful deterioration.
- Death cross approaching: SMA50D has fallen from $288.08 to $281.94 in 15 bars and is only about $3.9 above SMA200D ($278.02). It is closing at roughly $0.4–0.5 per day, so a death cross is likely within the next 1–2 weeks. EMA21 crossed below EMA55 in the prior decline and has stayed below it.
- MACD: The line recovered from -4.17 to -0.17 but has failed to cross above zero. It is now rolling over just above the signal line, a classic failed-bounce setup.
- RSI: No clear divergence. The lower-high structure in RSI (58 in Oct vs. 66 in May and 60 in Aug) matches the lower-high price structure.
- CMF: It briefly turned positive during the Oct 27–Nov 4 rally but never reached the +0.15 area. It has now reversed to negative, which confirms the rally was not supported by real buying.
- ADX/DI: −DI has stayed above +DI since the early-Oct breakdown except for a brief +DI spike on Oct 29 and Nov 4. Each rally has been sold.
- Trend: The Aug peak near $298–300 was followed by a series of lower highs ($291 → $284). That keeps the intermediate trend down.
CHART PATTERNS
- Descending Triangle / lower highs into flat support (Continuation, bearish): Price has set lower highs ($291 → $284) against a repeatedly tested floor around $269–270. A decisive close below $269 would activate the pattern. The measured move is about the pattern height of ~$15–20, so roughly $250–255.
- Bearish engulfing / rejection at the 21 EMA zone: The Nov 5 candle fell from about $284 to $271 and wiped out the prior two weeks of gains. This is a failed breakout above the EMA cluster.
- Counter-pattern (Bullish Double Bottom): The Oct lows near $269–270 and the Nov 5/6 low near $270 could form a double bottom, with the neckline around $284–285. It is unconfirmed and would need a close above $284.7, so I weight it as the minority case.
POTENTIAL SCENARIOS
- Scenario 1: Bearish Support Break & Death Cross Follow-Through — Sellers regain control as the MACD crosses down, SMA50D crosses below SMA200D, and price breaks the $269 floor (October lows and lower Bollinger Band). Trigger: daily close below $269.00 on above-average volume. Target: $260–$255 first, with $267 as the 34-day central target. Invalidation: daily close above $282 (EMA55/SMA50D). (52% probability)
- Scenario 2: Bullish Double-Bottom Recovery — Price holds $269–270, and the Oct and Nov lows act as a base. Buyers reclaim the EMA21 and SMA200D, and MACD crosses up. Trigger: close above $278.50 followed by $284.70 (upper Bollinger Band). Target: $284–$290. Invalidation: close below $268. (28% probability)
- Scenario 3: Neutral Range Chop — Price oscillates between $269 and $282 as ADX fades below 20 and the averages converge. Trigger: repeated failures at EMA21/SMA200D and holds above $269. Target: $270–$278. Invalidation: close outside $267–$284 range. (20% probability)
PRICE TARGETS
- Target Price: $267.00 (34-day target)
- Expected Range: $248.00 to $289.00 (width $41, about 15% of the current price, consistent with the 30–60 day guidance of 12–18%)
- Key Levels: Support at $269.00, Resistance at $278.00
OVERALL BIAS
OVERALL BIAS: BEARISH - Price is below every key moving average including the SMA200D, and −DI leads +DI by about 12 points. CMF shows distribution, the heavy-volume Nov 5 selloff is unresolved, the MACD is rolling over, and a death cross is imminent. Conviction is modest because price sits on the $269 support, where a double-bottom bounce is possible.
This is educational analysis and not financial advice.