KWEB 34-day bullish forecast — Nov 8, 2026
- Bias: Bullish
- Timeframe: 34 days (made Nov 8, 2026, target date Dec 11, 2026)
- Price at analysis: $24.88
- Price target: $25.70
- Expected range: $23.10 – $26.80
- Result: Pending — graded after the close on Dec 11, 2026
Get a free AI analysis of KWEB today
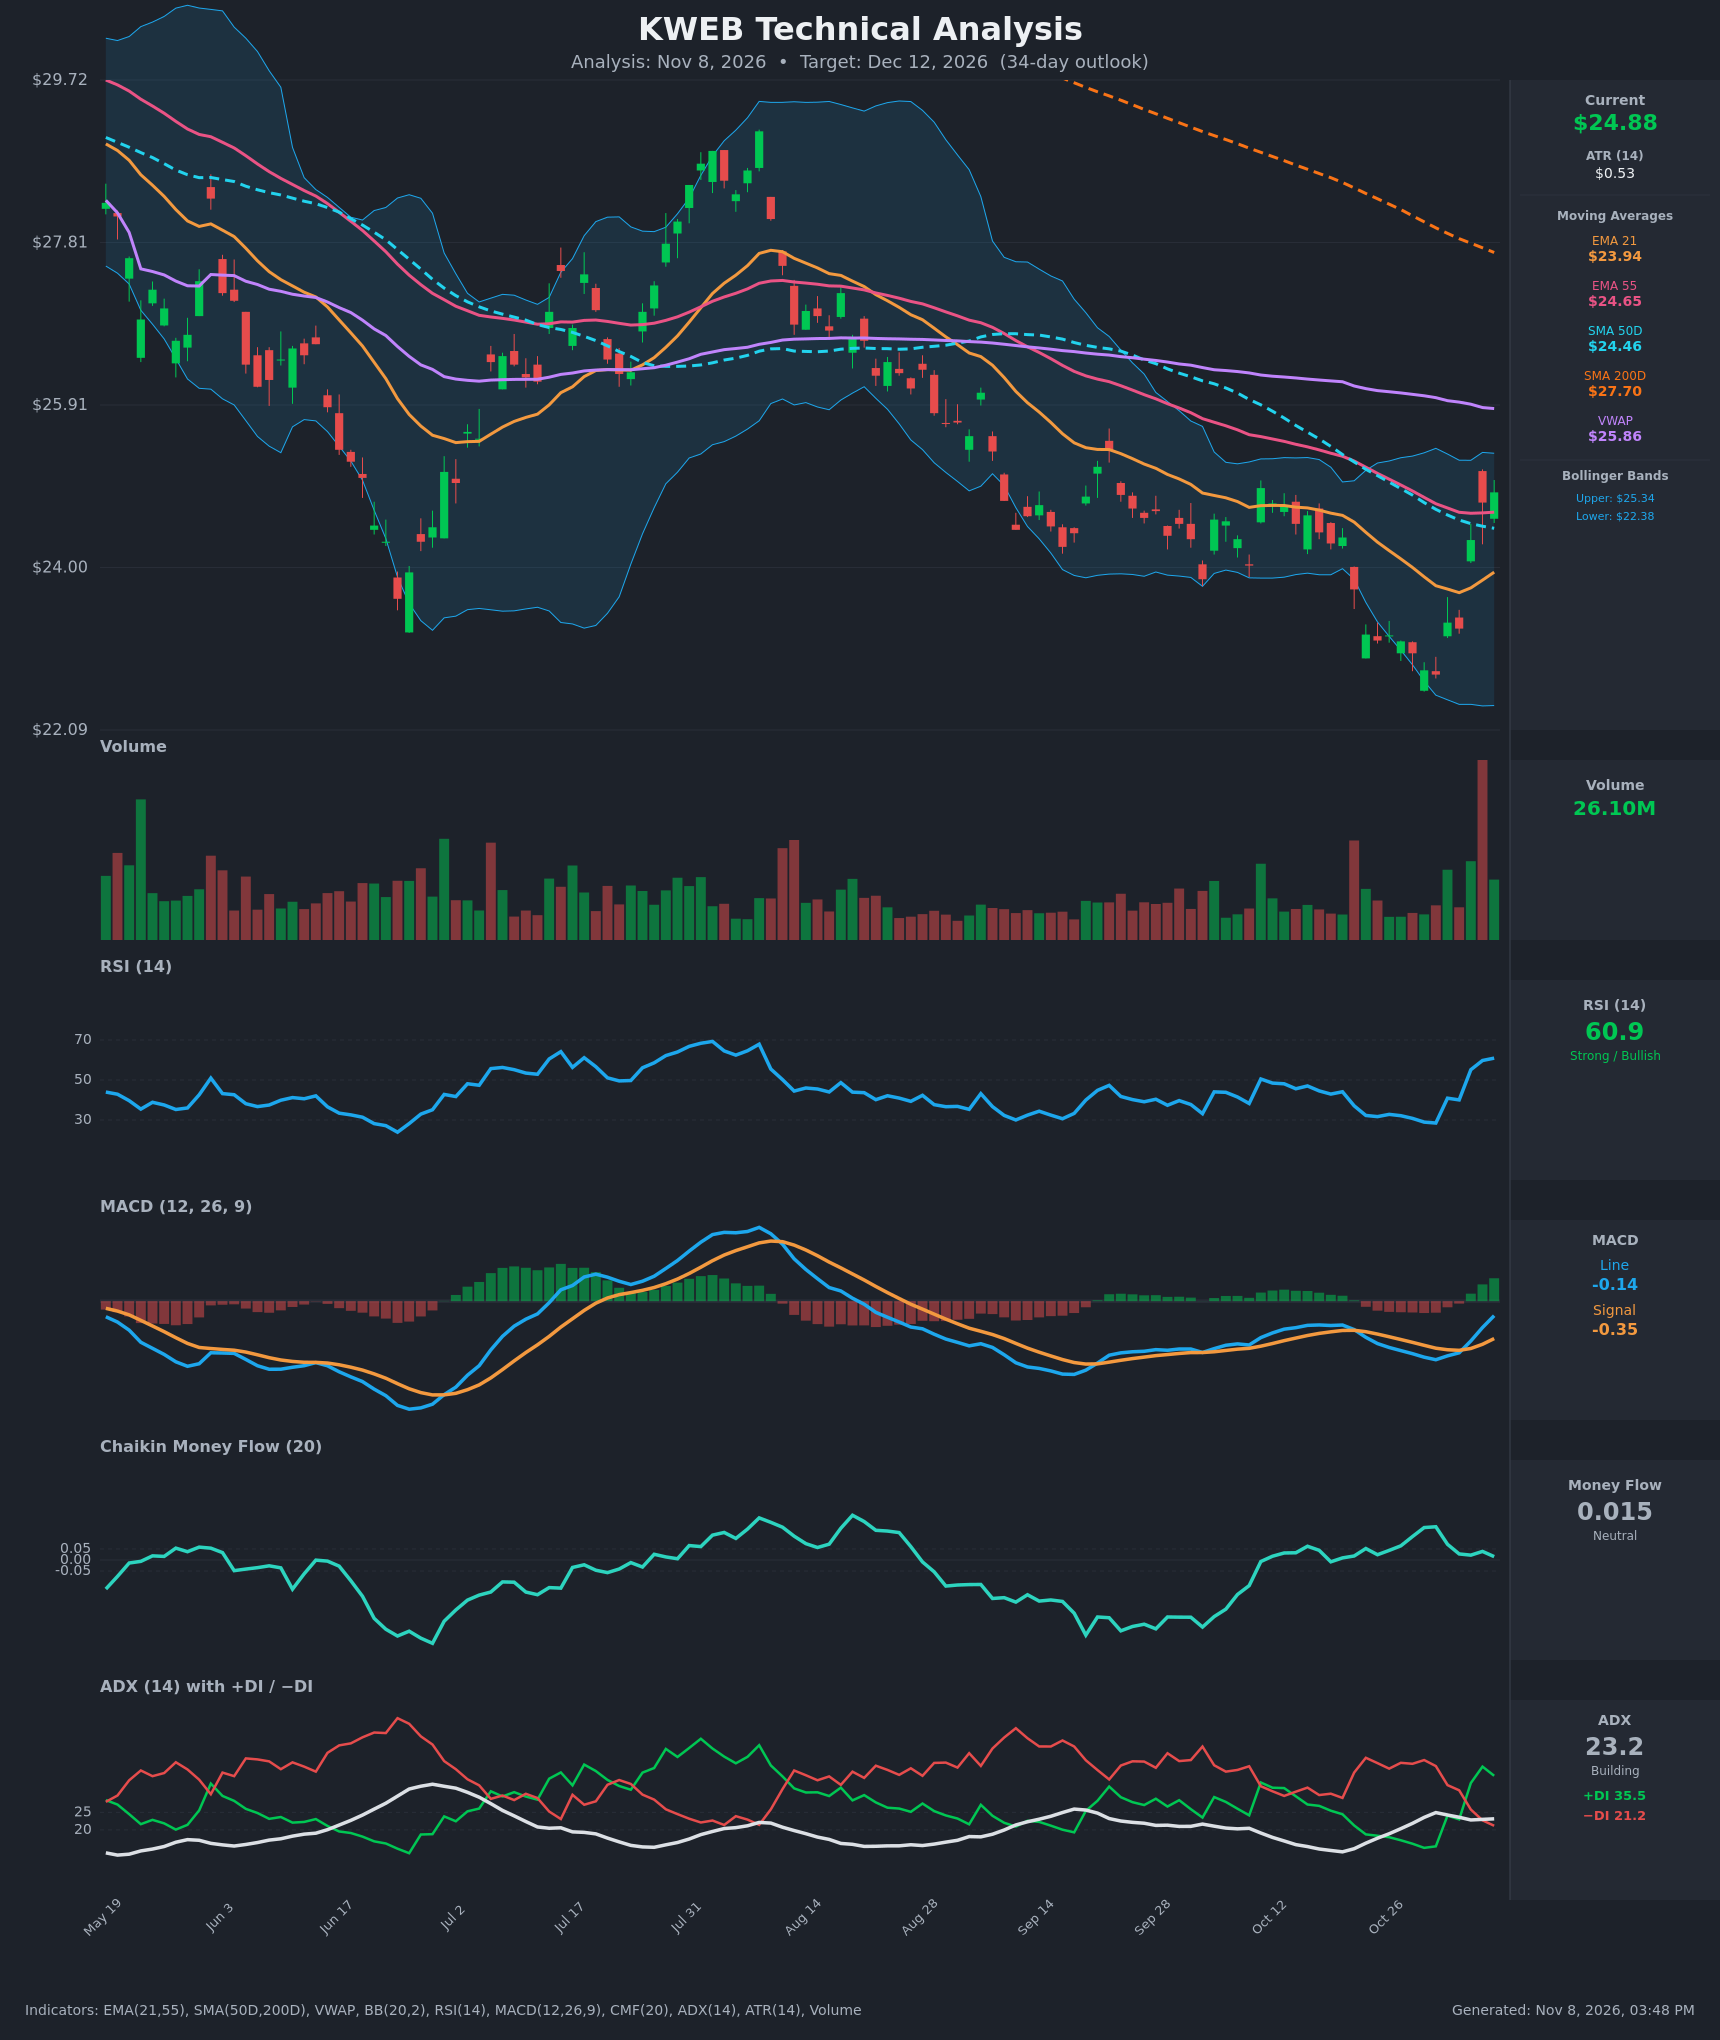
Analysis
TECHNICAL INDICATORS
- RSI (14): 60.93, up sharply from a 28.5 oversold low on Oct 30. It is in bullish territory but not yet overbought, with room to run toward 70. [Bullish]
- 20 EMA: The EMA 21 is $23.94 (EMA 55 is $24.65). Price at $24.88 is above both and has just reclaimed the EMA 55 after weeks below it. The EMA 21 is turning up, but EMA21 is still below EMA55, so the cross has not happened. [Bullish]
- MACD: Line -0.136, signal -0.351, histogram positive (about +0.21) and expanding. The line has risen quickly and is closing on the zero line. A bullish signal-line crossover occurred around Nov 4, but both lines are still below zero, so the trend change is unconfirmed. [Bullish]
- Bollinger Bands (20): Upper $25.34, lower $22.38, midline about $23.86. Price rebounded from the lower band and is in the upper half of the bands, about $0.46 below the upper band. The bands are wide after the selloff, which leaves room for a move toward the upper band. [Bullish]
- CMF (20): 0.015, within the ±0.05 neutral zone and drifting flat after rising from about 0.0 in early November. There is no clear accumulation yet to confirm the rally. [Neutral]
- ADX (14): 23.2, just below the 25 threshold and flattening. +DI (35.5) is above −DI (21.2) after a bullish DI crossover on Nov 4. Control has flipped to the bulls, but trend strength is still marginal. [Weak-to-Moderate Trend, Bullish direction]
- Volume: 26.10M on the latest bar, with a very large volume spike on the Nov 4 reversal. Heavy volume on the reversal suggests capitulation and a rebound, though follow-through needs to be confirmed. [Supportive of reversal]
Other moving averages and VWAP:
- SMA 50D: $24.46, now reclaimed as support.
- SMA 200D: $27.70, well overhead and declining. The SMA50 is below the SMA200 (death cross state), so the long-term trend is still down.
- VWAP: $25.86, overhead resistance.
DIVERGENCES & TRENDS
- Price made a new low at about $22.74 on Oct 30 with RSI at 28.5. The prior sell-off was accompanied by −DI above 38, and that bearish momentum has now reversed sharply.
- The MACD signal-line crossover (Nov 4) and the DI crossover (+DI over −DI on Nov 4) occurred together with a price break back above EMA 21, EMA 55 and SMA 50. That is a cluster of bullish confirmations.
- The macro structure is still bearish. Price is below SMA200 ($27.70) and VWAP ($25.86), the SMA50 is below the SMA200, and the SMA50 is still sloping down.
- The MACD histogram is positive but the lines are below zero, which is typical of an early-stage bounce within a larger downtrend.
- CMF is lagging and flat, which does not yet confirm the price surge.
CHART PATTERNS
- Bullish Falling Wedge / descending channel breakout: The Aug–Oct decline formed lower highs and lower lows along a descending channel. The Nov 4–6 break above the upper trendline and the SMA50/EMA55 cluster resembles a falling wedge resolving upward. A typical measured move retraces toward the start of the wedge, roughly $25.9–$26.5, which coincides with VWAP.
- V-shaped reversal: The rebound from the $22.74 capitulation low on heavy volume is a sharp V-bottom. These often retest part of the breakdown zone, so a pullback to $24.0–$24.6 is plausible before the next leg up.
- Overhead supply: The $25.3–$25.9 zone (BB upper band, VWAP, prior breakdown area) is the first major barrier. The SMA200 at $27.70 is the long-term cap.
POTENTIAL SCENARIOS
- Scenario 1: Bullish Reversal Continuation — Price holds above the SMA50/EMA55 zone and grinds higher as MACD pushes through zero and ADX moves above 25. Trigger: a daily close above $25.34 (upper Bollinger Band), then VWAP at $25.86. Target: $25.70–$26.40. Invalidation: a daily close below $23.94 (EMA 21). (55% probability)
- Scenario 2: Bearish Failed Bounce — The rally stalls at resistance as a dead-cat bounce within the larger downtrend, with price rejected under VWAP and the SMA200 declining overhead. Trigger: rejection at $25.34–$25.86 followed by a close below $24.46 (SMA 50). Target: $23.10–$23.90, with a retest of the $22.74 low if momentum fails. Invalidation: a daily close above $25.90. (30% probability)
- Scenario 3: Neutral Consolidation — Price digests the rally between the SMA50 and VWAP as ADX stays under 25. Trigger: failure to break $25.34 or lose $24.46. Target: $24.40–$25.40. Invalidation: a close outside $23.90–$25.90. (15% probability)
PRICE TARGETS
- Target Price: $25.70 (34-day horizon)
- Expected Range: $23.10 to $26.80 (width $3.70, about 14.9% of the current price, consistent with the 30–60 day guidance of 12–18%)
- Key Levels: Support at $24.46 (SMA 50, then EMA 21 at $23.94), Resistance at $25.86 (VWAP, with the upper Bollinger Band at $25.34 as first hurdle)
OVERALL BIAS
OVERALL BIAS: BULLISH - A high-volume V-reversal from oversold levels, a MACD crossover, +DI over −DI, and a reclaim of the EMA 21/EMA 55/SMA 50 favor further upside toward the VWAP area. Gains are likely capped near $25.9–$26.8 by VWAP and the declining SMA200, and conviction is modest because ADX is below 25 and CMF is neutral.
This is educational analysis and not financial advice.