QQQ 34-day bearish forecast — Nov 8, 2026
- Bias: Bearish
- Timeframe: 34 days (made Nov 8, 2026, target date Dec 11, 2026)
- Price at analysis: $656.10
- Price target: $638.00
- Expected range: $590.00 – $690.00
- Result: Pending — graded after the close on Dec 11, 2026
Get a free AI analysis of QQQ today
Analysis
TECHNICAL INDICATORS
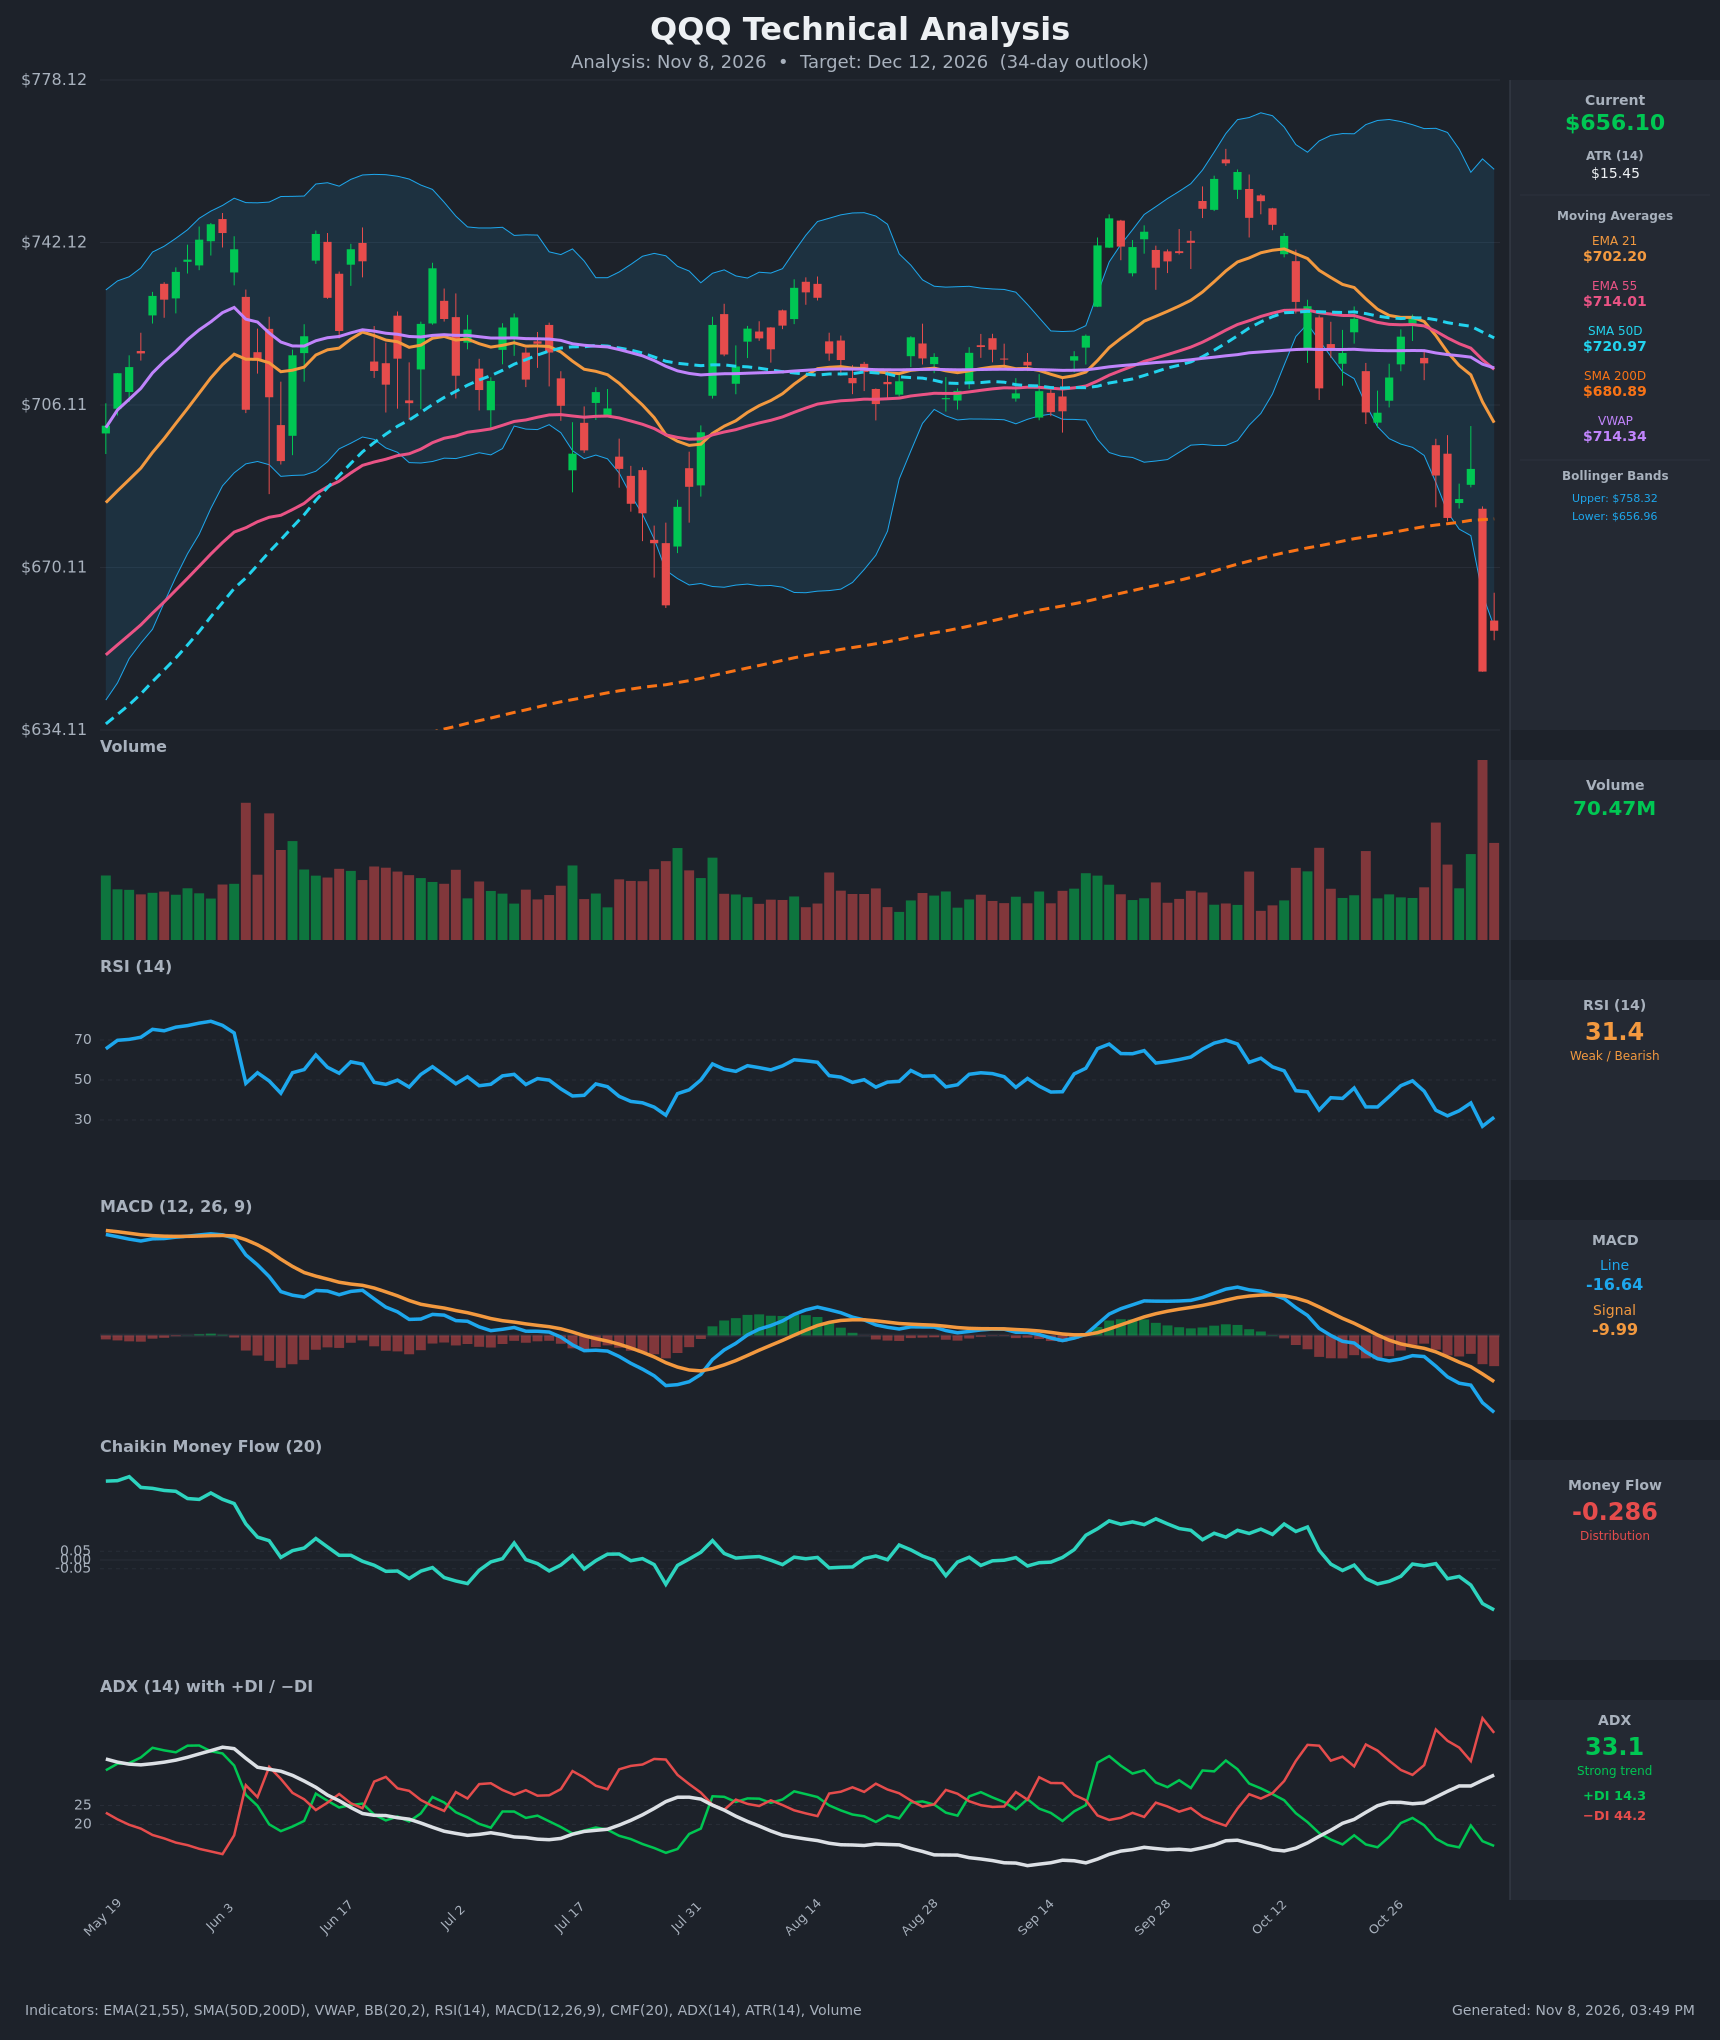
- RSI (14): 31.37, just bounced off 26.9 (Nov 5) and sitting at the edge of oversold. The trend from 49.6 on Oct 28 is sharply down. A bounce is possible, but there is no bullish divergence yet. [Bearish]
- 20 EMA (EMA 21 = $702.20): Price at $656.10 is about 6.6% below it, and the EMA is sloping down steeply. EMA 21 ($702.20) is below EMA 55 ($714.01), a bearish crossover that occurred around Oct 30. Both averages now act as overhead resistance. [Bearish]
- MACD: Line -16.64 is below Signal -9.99, with the gap widening (histogram about -6.6 and expanding). The bearish crossover occurred around Oct 26 and the line is making new lows. [Bearish]
- Bollinger Bands (20): Price ($656.10) is hugging the lower band ($656.96) after a gap-down. The bands are wide (upper $758.32), so volatility is expanding. In a strong trend, band-walking tends to continue, although a snap-back toward the $714 midline is the usual relief move. [Bearish]
- CMF (20): -0.286, deep in distribution and falling steadily from the near-zero range. Selling pressure is heavy and persistent. [Distribution]
- ADX (14): 33.1 and rising, which marks a strong trend. -DI (44.2) is far above +DI (14.3), so bears are firmly in control. [Strong Trend – Bearish]
- Volume: 70.47M, with the Nov 5 gap-down bar being the highest volume of the chart. Heavy volume on the breakdown confirms real selling and could include some capitulation. The next day's bounce came on lower volume. [Bearish – distribution/breakdown volume]
DIVERGENCES & TRENDS
- No bullish divergence yet: RSI (26.9 to 31.4), MACD and CMF are all making lower lows in line with price. There is no momentum-based reversal evidence.
- Moving averages: EMA 21 crossed below EMA 55 around Oct 30. SMA 50D ($720.97) is still above SMA200D ($680.89) but falling, so a death cross is a risk in the coming weeks.
- Long-term trend break: Price closed below SMA200D ($680.89) for the first time on this chart, on a large gap. The SMA200D is now overhead resistance.
- VWAP: Price is about 8% below VWAP ($714.34), which signals strong selling pressure and room for a mean-reversion bounce.
- DI: -DI has been above +DI since mid-October. Each rally attempt (Oct 21, Oct 27-28) failed at the declining EMAs.
- Oversold risk: RSI near 30 with price at the lower band raises the odds of a short-term relief rally. Such rallies in a trend with ADX above 30 typically stall at resistance.
CHART PATTERNS
- Loose Bearish Double Top / range breakdown: Highs near $745-$750 (June and early October) and the neckline near $660-$665 (the late-July low). The Nov 5 gap closed below that neckline, which supports a bearish reversal. The measured move (~$88) points to roughly $575 over a longer horizon, and a 34-day target would capture only part of it.
- Bearish continuation structure: The price failed to hold above the 21/55 EMA cluster and has dropped in a steep, impulsive leg, which resembles a bearish flag or pennant after the Oct 30-Nov 5 declines. A relief bounce into $680-$700 would fit that pattern.
- No bullish reversal pattern (double bottom or falling wedge) is visible yet.
POTENTIAL SCENARIOS
- Scenario 1: Bearish Trend Continuation — Distribution, a strong ADX and the SMA200D loss lead to lower lows after a brief bounce stalls under the declining EMAs. Trigger: a daily close below $647 (the Nov 5 low/close). Target: $620-$640, with an extension toward $600. Invalidation: a daily close above $700 (EMA 21 reclaimed). (50% probability)
- Scenario 2: Bullish Oversold Relief Rally — RSI and the lower-band touch spark a snap-back toward the SMA200D and EMA 21 before sellers re-engage. Trigger: a hold above $647 and a close above $681 (SMA200D). Target: $695-$705. Invalidation: a break below $640. (30% probability)
- Scenario 3: Neutral Base-Building Chop — Price stabilizes between $640 and $685 as selling exhausts. Trigger: declining volume and RSI holding above 30. Target: $650-$670. Invalidation: a close outside the $640-$685 range. (20% probability)
PRICE TARGETS
- Target Price: $638.00 (34-day horizon)
- Expected Range: $590.00 to $690.00 (width $100, about 15.2% of the current price, in line with the 30-60 day guidance)
- Key Levels: Support at $647.00, Resistance at $680.89
OVERALL BIAS
OVERALL BIAS: BEARISH - A strong, rising ADX (33.1) with -DI dominant, a bearish MACD, deep CMF distribution and a high-volume breakdown below the SMA200D and all other moving averages outweigh the oversold RSI. Expect a possible relief bounce into the $680-$700 area to be sold, with downside toward $638.
This is educational analysis and not financial advice.