QCOM 34-day bullish forecast — Nov 8, 2026
- Bias: Bullish
- Timeframe: 34 days (made Nov 8, 2026, target date Dec 11, 2026)
- Price at analysis: $165.41
- Price target: $169.00
- Expected range: $153.50 – $181.00
- Result: Pending — graded after the close on Dec 11, 2026
Get a free AI analysis of QCOM today
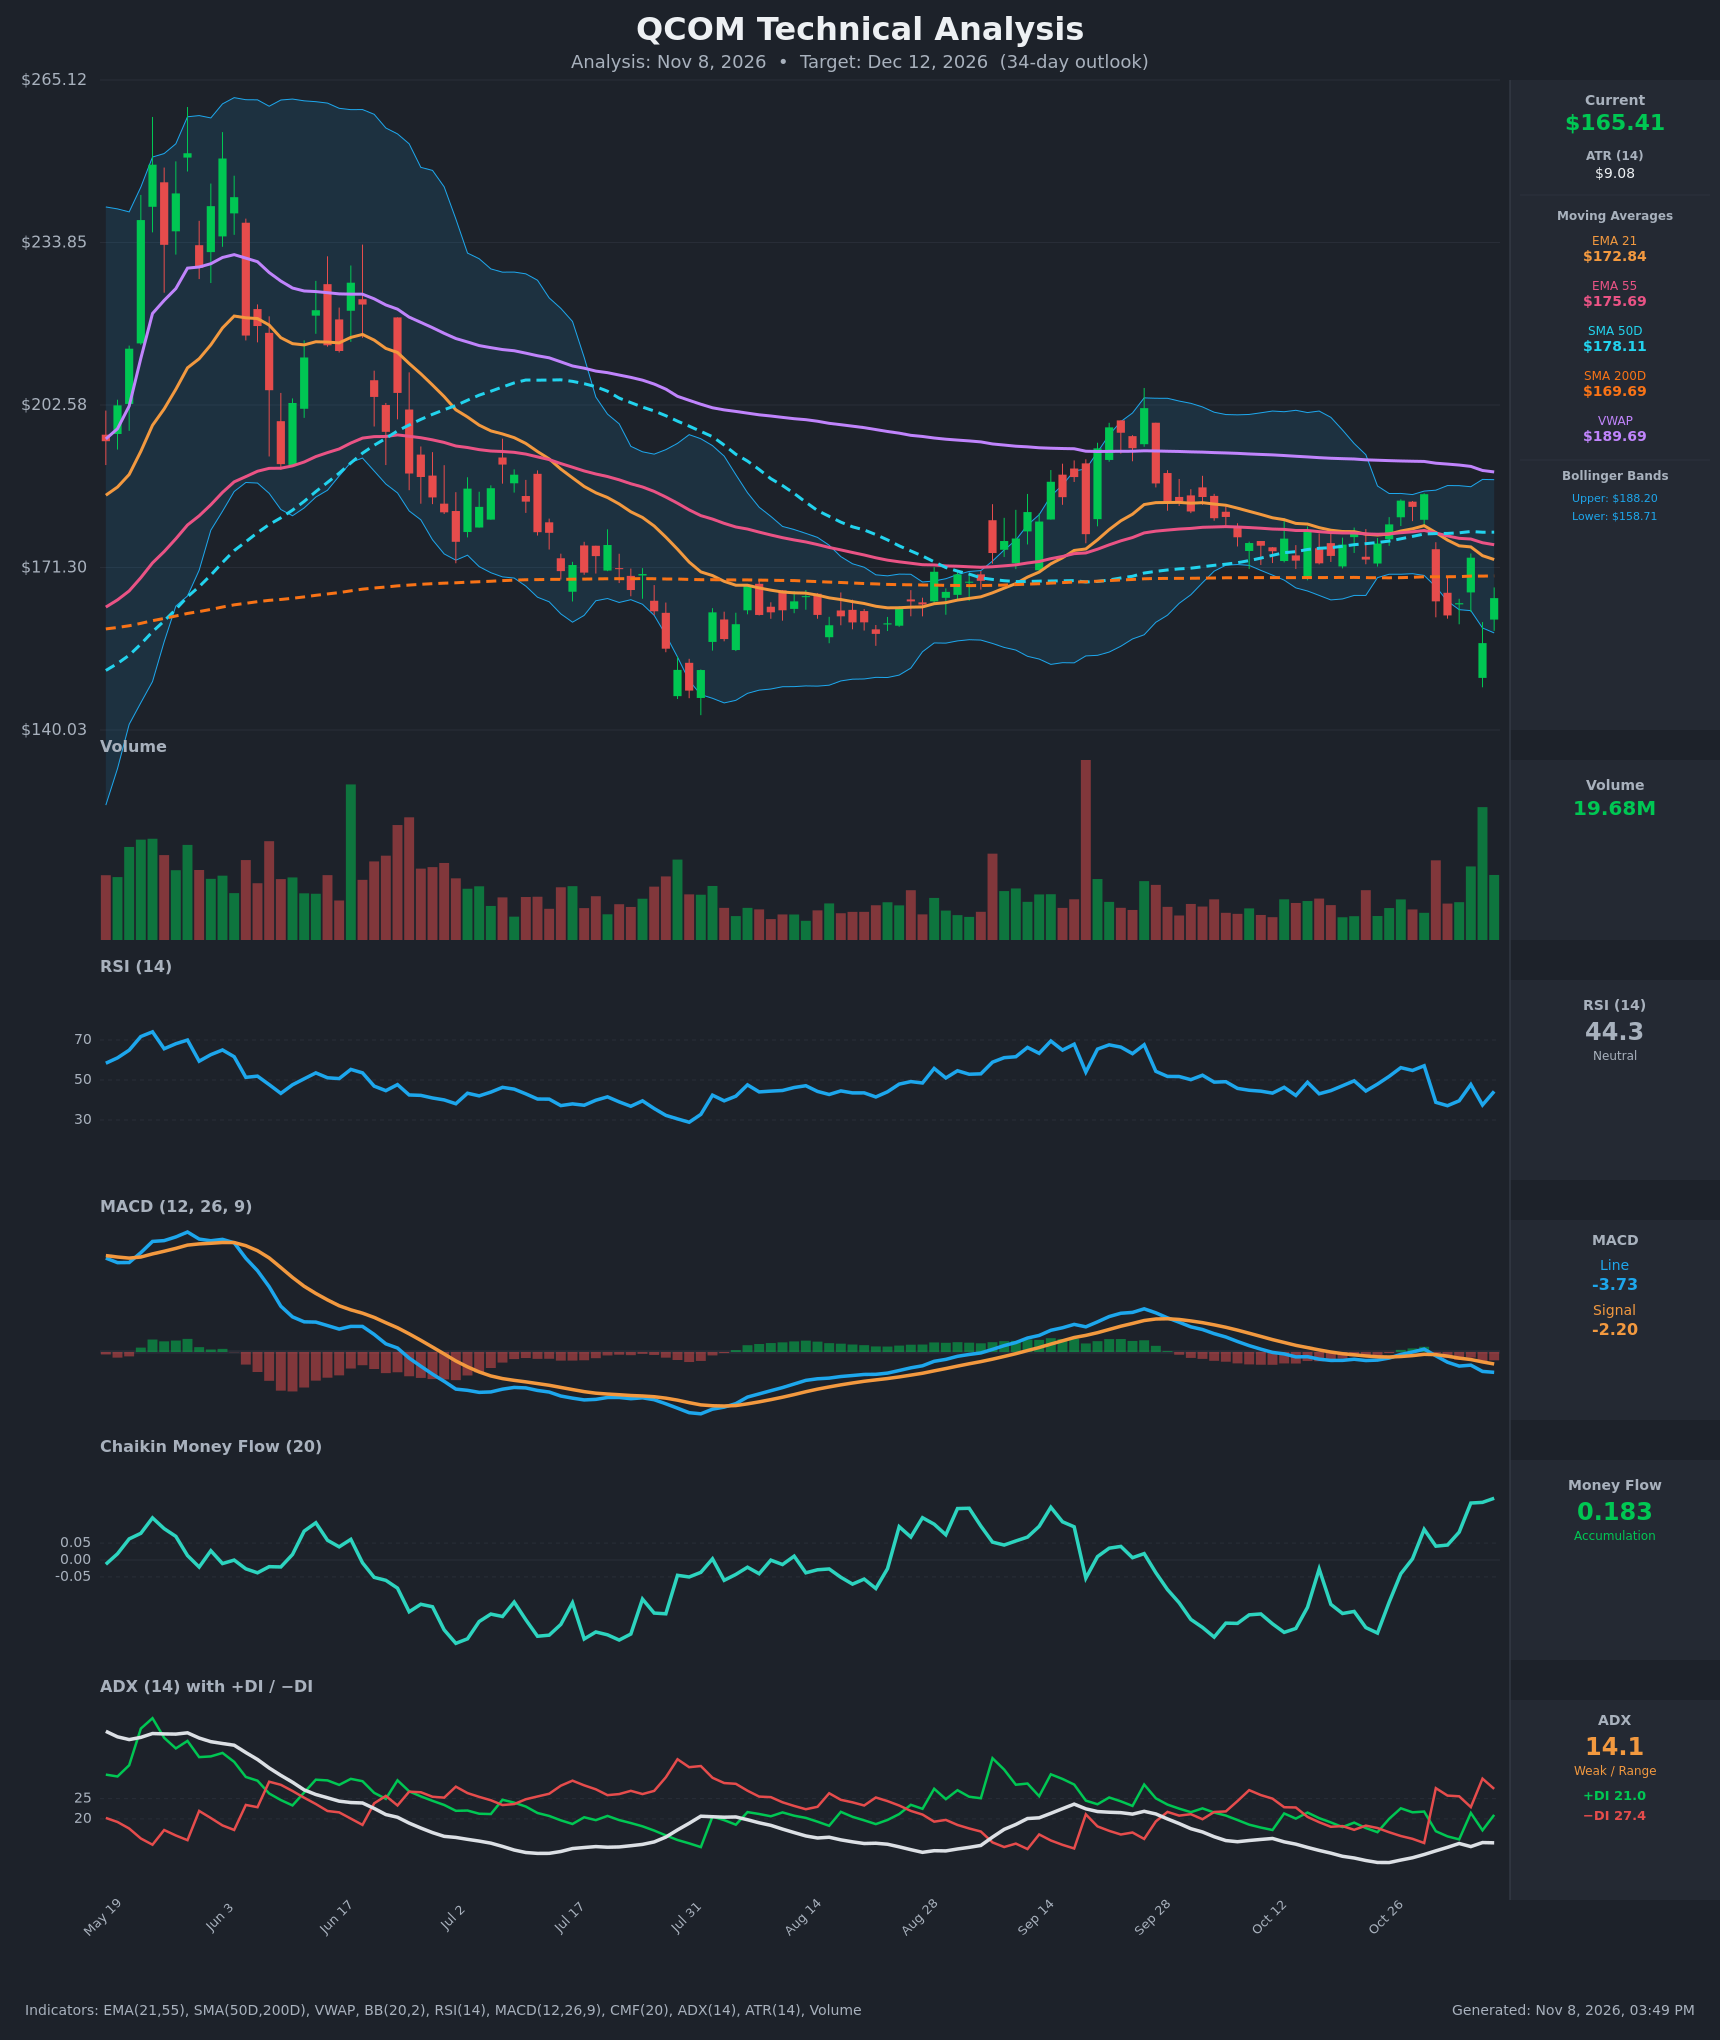
Analysis
TECHNICAL INDICATORS
- RSI (14): 44.29, below the 50 midline but well off the 37.2 low of Nov 5. It has bounced from 37.5 to 44.3 in one bar, after being rejected from 57 on Oct 29. Momentum is soft, not oversold. [Neutral]
- 20 EMA: The EMA 21 is $172.84 and price ($165.41) is below it, about 4.3% under. It is sloping down and has crossed below the EMA 55 ($175.69). It acts as overhead resistance. [Bearish]
- MACD: The line is -3.73 against a signal of -2.20, so it sits below the signal. The bearish crossover occurred around Oct 30, and the histogram has been getting more negative (about -1.5). Downside momentum is still building, though the chart's histogram is shallow. [Bearish]
- Bollinger Bands (20): The upper band is $188.20 and the lower is $158.71. Price at $165.41 is in the lower third of the bands, about 22% of the band width above the lower band. The Nov 5 low of $156.75 pierced the lower band and was bought back up. The bands are wide because of the earnings gap. [Neutral]
- CMF (20): 0.183, above +0.05 and rising from negative readings in late October. It has been positive since Oct 28. Buying pressure is showing up even as price falls, which is a constructive divergence. [Accumulation]
- ADX (14): 14.1, a weak/range-bound reading. −DI (27.4) is above +DI (21.0), so sellers lead, but the trend lacks strength. [Weak Trend, bearish lean]
- Volume: 19.68M on the latest bar, among the highest of the period. The large spike came on the Nov 5 flush to $156.75, which then reversed to close higher. That points to possible capitulation or absorption, but it needs follow-through. [Potential capitulation / Neutral-to-Bullish]
DIVERGENCES & TRENDS
- Bullish divergence: CMF has risen from -0.2 to +0.18 while price made a lower low. Volume was heavy at the Nov 5 low and the bounce held.
- Trend structure: Price is below EMA21, EMA55, SMA50D ($178.11) and SMA200D ($169.69). It is also far below VWAP ($189.69). This is bearish positioning.
- Crossovers: EMA21 crossed below EMA55 after Oct 29. The MACD bearish cross was on Oct 30. The −DI/+DI flip was on Oct 30. SMA50D ($178.11) is still above SMA200D ($169.69), so there is no death cross yet, but they are converging.
- Earnings gap: The Oct 30 gap of about -11% broke the Sept–Oct consolidation range of roughly $170–$185 and cut straight through the SMA200.
- ADX: At 14 and flat, it shows no established trend, so a snap-back toward the moving-average cluster is plausible.
CHART PATTERNS
- Gap down from a consolidation (Oct): Price spent about a month in a sideways range of $170–$185 (similar to a Symmetrical/Descending Triangle). It then broke down on earnings. The measured move of roughly $15 from the $170 base points to about $155, which was already tested at the Nov 5 low of $156.75.
- Potential Double Bottom (Bullish): The Nov 2 close of $162 and the Nov 5 low of $156.75 form a rough double-bottom attempt near the lower Bollinger Band. The neckline is around $173 (Nov 4 close and EMA21). A close above it would target about $185–$190. This is not confirmed.
- Overall: There is no clean pattern. The bearish breakdown and the bullish basing attempt are both in play.
POTENTIAL SCENARIOS
- Scenario 1: Bullish Relief Bounce Toward the Moving-Average Cluster — CMF accumulation and the high-volume reversal off the lower Bollinger Band support a recovery. Weak ADX favors mean reversion toward the SMA200 and EMA21. Trigger: close above $169.70 (SMA200), then above $172.84 (EMA21). Target: $172–$178 (EMA55/SMA50D). Invalidation: close below $156.75. (45% probability)
- Scenario 2: Bearish Continuation After the Earnings Breakdown — Price sits below all major moving averages with −DI dominant and a falling MACD. A failed bounce at $170–$173 would lead to a retest of the lows. Trigger: rejection at the SMA200/EMA21 or a close below $156.75. Target: $148–$152 (the July low area is near $145). Invalidation: close above $173. (35% probability)
- Scenario 3: Neutral Choppy Range — Price consolidates between the Nov 5 low and the SMA200 with low ADX. Trigger: failure to close above $170 or below $157. Target: $158–$170. Invalidation: close outside $156–$173. (20% probability)
PRICE TARGETS
Timeframe: 34 days (Dec 12, 2026). The 30–60 day guidance is 12–18% width. ATR is $9.08, about 5.5% of price, which supports a wide range.
- Target Price: $169.00
- Expected Range: $153.50 to $181.00 (width $27.50, about 16.6% of the current price, which fits the 34-day guidance)
- Key Levels: Support at $156.75, Resistance at $172.84 (the SMA200 at $169.69 is the first hurdle)
OVERALL BIAS
OVERALL BIAS: BULLISH - The bias is modestly bullish with low conviction. CMF accumulation and a high-volume reversal off the lower Bollinger Band favor a relief bounce toward the SMA200/EMA21 area, although price is still below all key moving averages, the MACD is negative and −DI leads. A close below $156.75 would invalidate the call.
This is educational analysis and not financial advice.