SMCI 34-day bearish forecast — Nov 8, 2026
- Bias: Bearish
- Timeframe: 34 days (made Nov 8, 2026, target date Dec 11, 2026)
- Price at analysis: $28.76
- Price target: $26.90
- Expected range: $24.50 – $29.50
- Result: Pending — graded after the close on Dec 11, 2026
Get a free AI analysis of SMCI today
Analysis
TECHNICAL INDICATORS
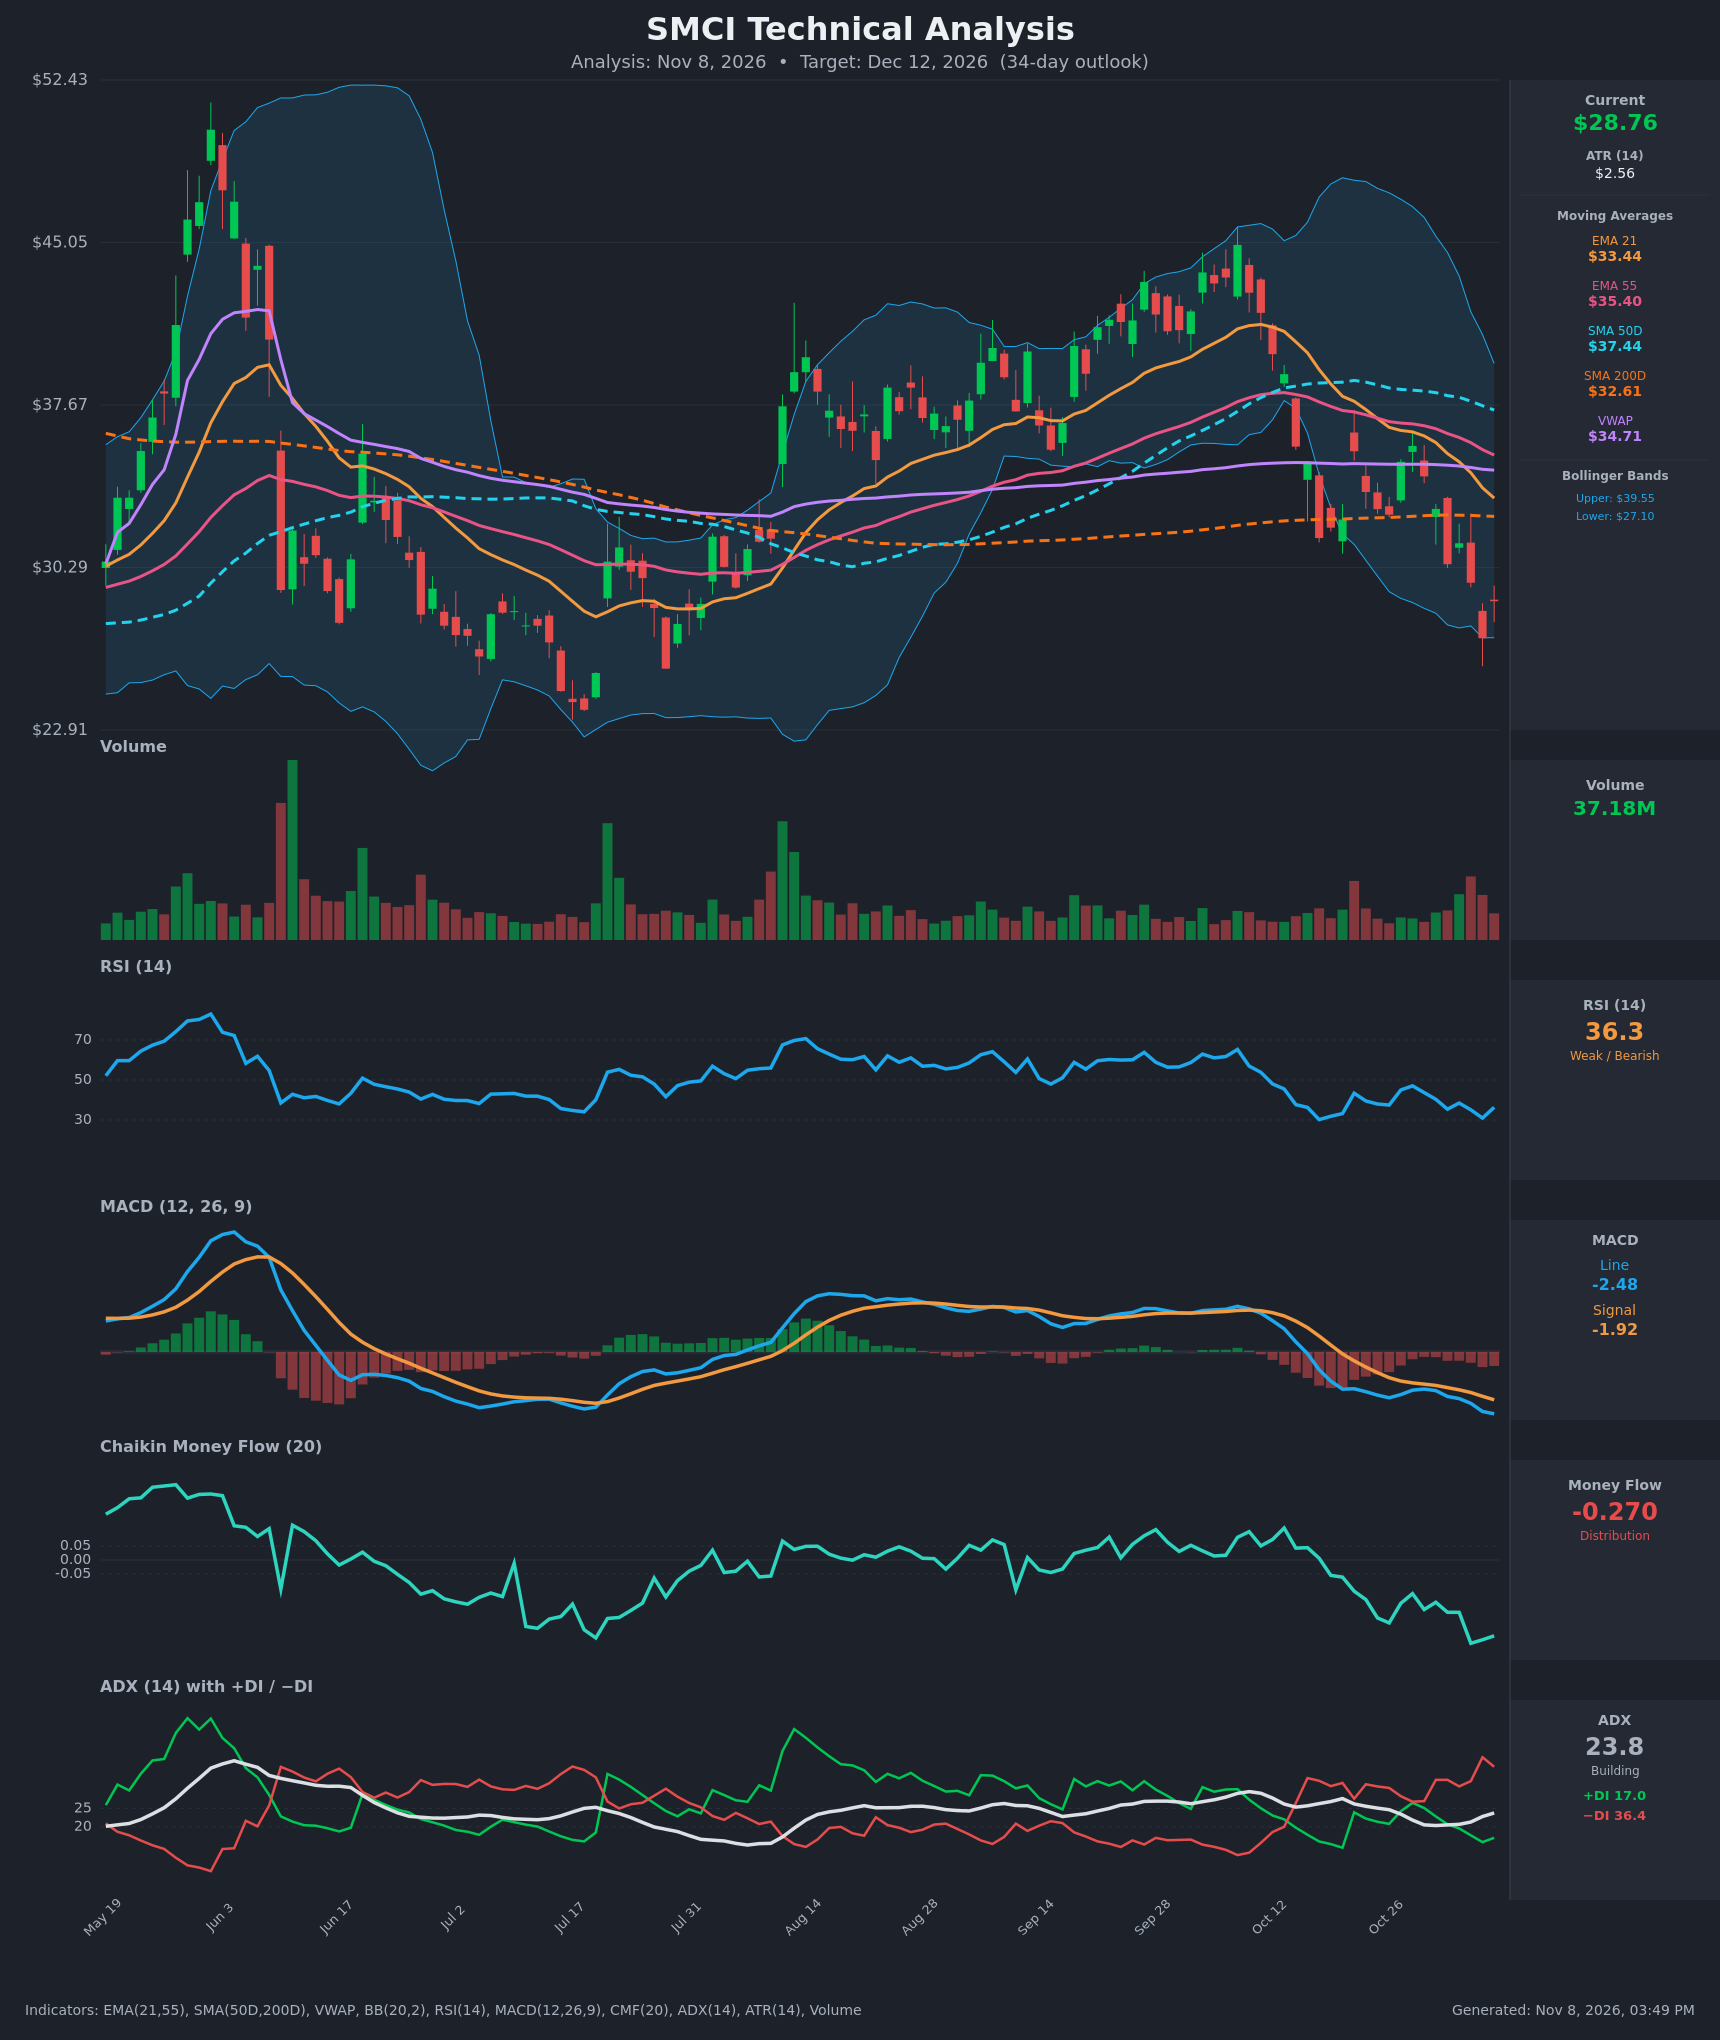
- RSI (14): 36.34, in the weak zone but not yet oversold. It bounced from 31.0 on Nov 5, but the pattern is lower highs (47 → 45 → 38) and lower lows. Momentum remains bearish. [Bearish]
- 20 EMA (EMA 21 = $33.44): Price at $28.76 is about 14% below it, and the EMA is falling steeply (from $38.62 on Oct 19). It acts as overhead resistance. EMA21 is also below EMA55 ($35.40), a bearish cross that occurred around Oct 23. [Bearish]
- MACD: Line -2.48 is below signal -1.92, and the gap is widening. The histogram is negative and expanding, and the line is at its lowest level since the June decline. There is no sign of a bullish cross yet. [Bearish]
- Bollinger Bands (20): Upper $39.55, lower $27.11. Price is in the bottom 10% of the band, and the Nov 5 close at $27.08 touched the lower band. Bands are wide, so volatility is elevated. Price is "walking the band" lower, which is bearish in a trend, though a short-term bounce toward the midline is possible. [Bearish]
- CMF (20): -0.270, deep distribution and the weakest reading on the chart since the May-June selloff. It has fallen steadily from positive in early October, showing persistent selling pressure with no sign of accumulation. [Distribution]
- ADX (14): 23.8 and rising from 20.3, with −DI (36.4) far above +DI (17.0). The trend is approaching "strong" territory with bears firmly in control. A move above 25 would confirm the downtrend. [Building Trend – Bearish]
- Volume: 37.18M, elevated, with the largest bars of the recent period on red candles in late October and early November. Selling is heavy, and the lack of a volume spike on the Nov 5 low suggests no capitulation yet. [Bearish – distribution]
DIVERGENCES & TRENDS
- No bullish divergence yet. Price made a new low on Nov 5 ($27.08) and RSI (31.0) and MACD also made new lows, so momentum confirms price.
- Moving averages: Price is below EMA21, EMA55, SMA50D ($37.44), VWAP ($34.71) and SMA200D ($32.61). The EMA21/55 bearish cross is already in. SMA50D remains above SMA200D, but the gap is narrowing (about $4.8). A death cross is possible within weeks if the decline continues.
- Price vs SMA200D: A close below the 200-day for the first time since the summer base turns the long-term picture bearish.
- DI lines: −DI has been above +DI since Oct 22 (except briefly on Oct 28), and the gap is widening again.
- CMF and volume: Sustained negative CMF with lower highs in the oscillators confirms the downtrend. The main risk is a bounce from near-oversold RSI and the lower Bollinger Band.
CHART PATTERNS
- Loose Bearish Double Top: Highs near $42 (Aug) and $45 (Oct 9) were followed by a breakdown through the $32–33 area, the neckline of the Jul–Oct base and also the SMA200D. A full measured move (~$12.5) would point toward $20, but that is beyond a 34-day horizon.
- Lower highs since Oct 9: The Oct 21, Oct 27/28 and Nov 2 bounces failed at lower levels (about $35.6–35.8). This resembles a Bearish Flag/Descending channel, which is a continuation pattern.
- Support zone: The Nov 5 low ($27.08) coincides with the lower Bollinger Band. A break would open the $25–$25.5 area, near the July lows.
POTENTIAL SCENARIOS
- Scenario 1: Bearish Trend Continuation — Sellers stay in control (−DI dominant, CMF deeply negative, MACD widening), and rallies fail near EMA21 or the $30–31 area. Price breaks the Nov 5 low and tests the $25–26 region, with ADX rising above 25. Trigger: daily close below $27.08. Target: $25.00–$26.90. Invalidation: daily close above $31.40 with MACD histogram turning up. (52% probability)
- Scenario 2: Bullish Oversold Relief Bounce — RSI near 30 and the lower Bollinger Band attract dip buyers, and a short-covering rally pushes price toward the SMA200D and EMA21, similar to the Oct 21 and Oct 27 pops. Trigger: close above $30.44 on rising volume. Target: $32.60–$33.40 (SMA200D/EMA21). Invalidation: failure at $30–31 and a close back below $28. (30% probability)
- Scenario 3: Neutral Choppy Base — Price stays between $27 and $30.50 as volatility compresses and the ADX stalls. Trigger: holds above $27.08 without clearing $30.44. Target: $27.50–$30.00. Invalidation: close outside the $27.08–$30.44 range. (18% probability)
PRICE TARGETS
- Target Price: $26.90 (34-day horizon, about -6.5% from $28.76)
- Expected Range: $24.50 to $29.50 (width $5.00, about 17.4% of current price, consistent with the 30–60 day guidance of 12–18%)
- Key Levels: Support at $27.08 (Nov 5 low / lower Bollinger Band), Resistance at $30.44 (Nov 2 close, with the SMA200D at $32.61 as the next major hurdle)
OVERALL BIAS
OVERALL BIAS: BEARISH - Price sits below every major moving average, MACD is widening negative, CMF is at -0.27 (heavy distribution), and −DI (36.4) dominates +DI (17.0) with ADX rising. The main risk is an oversold bounce from the lower Bollinger Band toward $32–33, which makes conviction moderate.
This is educational analysis and not financial advice.