SPCX 34-day bearish forecast — Nov 8, 2026
- Bias: Bearish
- Timeframe: 34 days (made Nov 8, 2026, target date Dec 11, 2026)
- Price at analysis: $134.27
- Price target: $125.50
- Expected range: $108.00 – $146.00
- Result: Pending — graded after the close on Dec 11, 2026
Get a free AI analysis of SPCX today
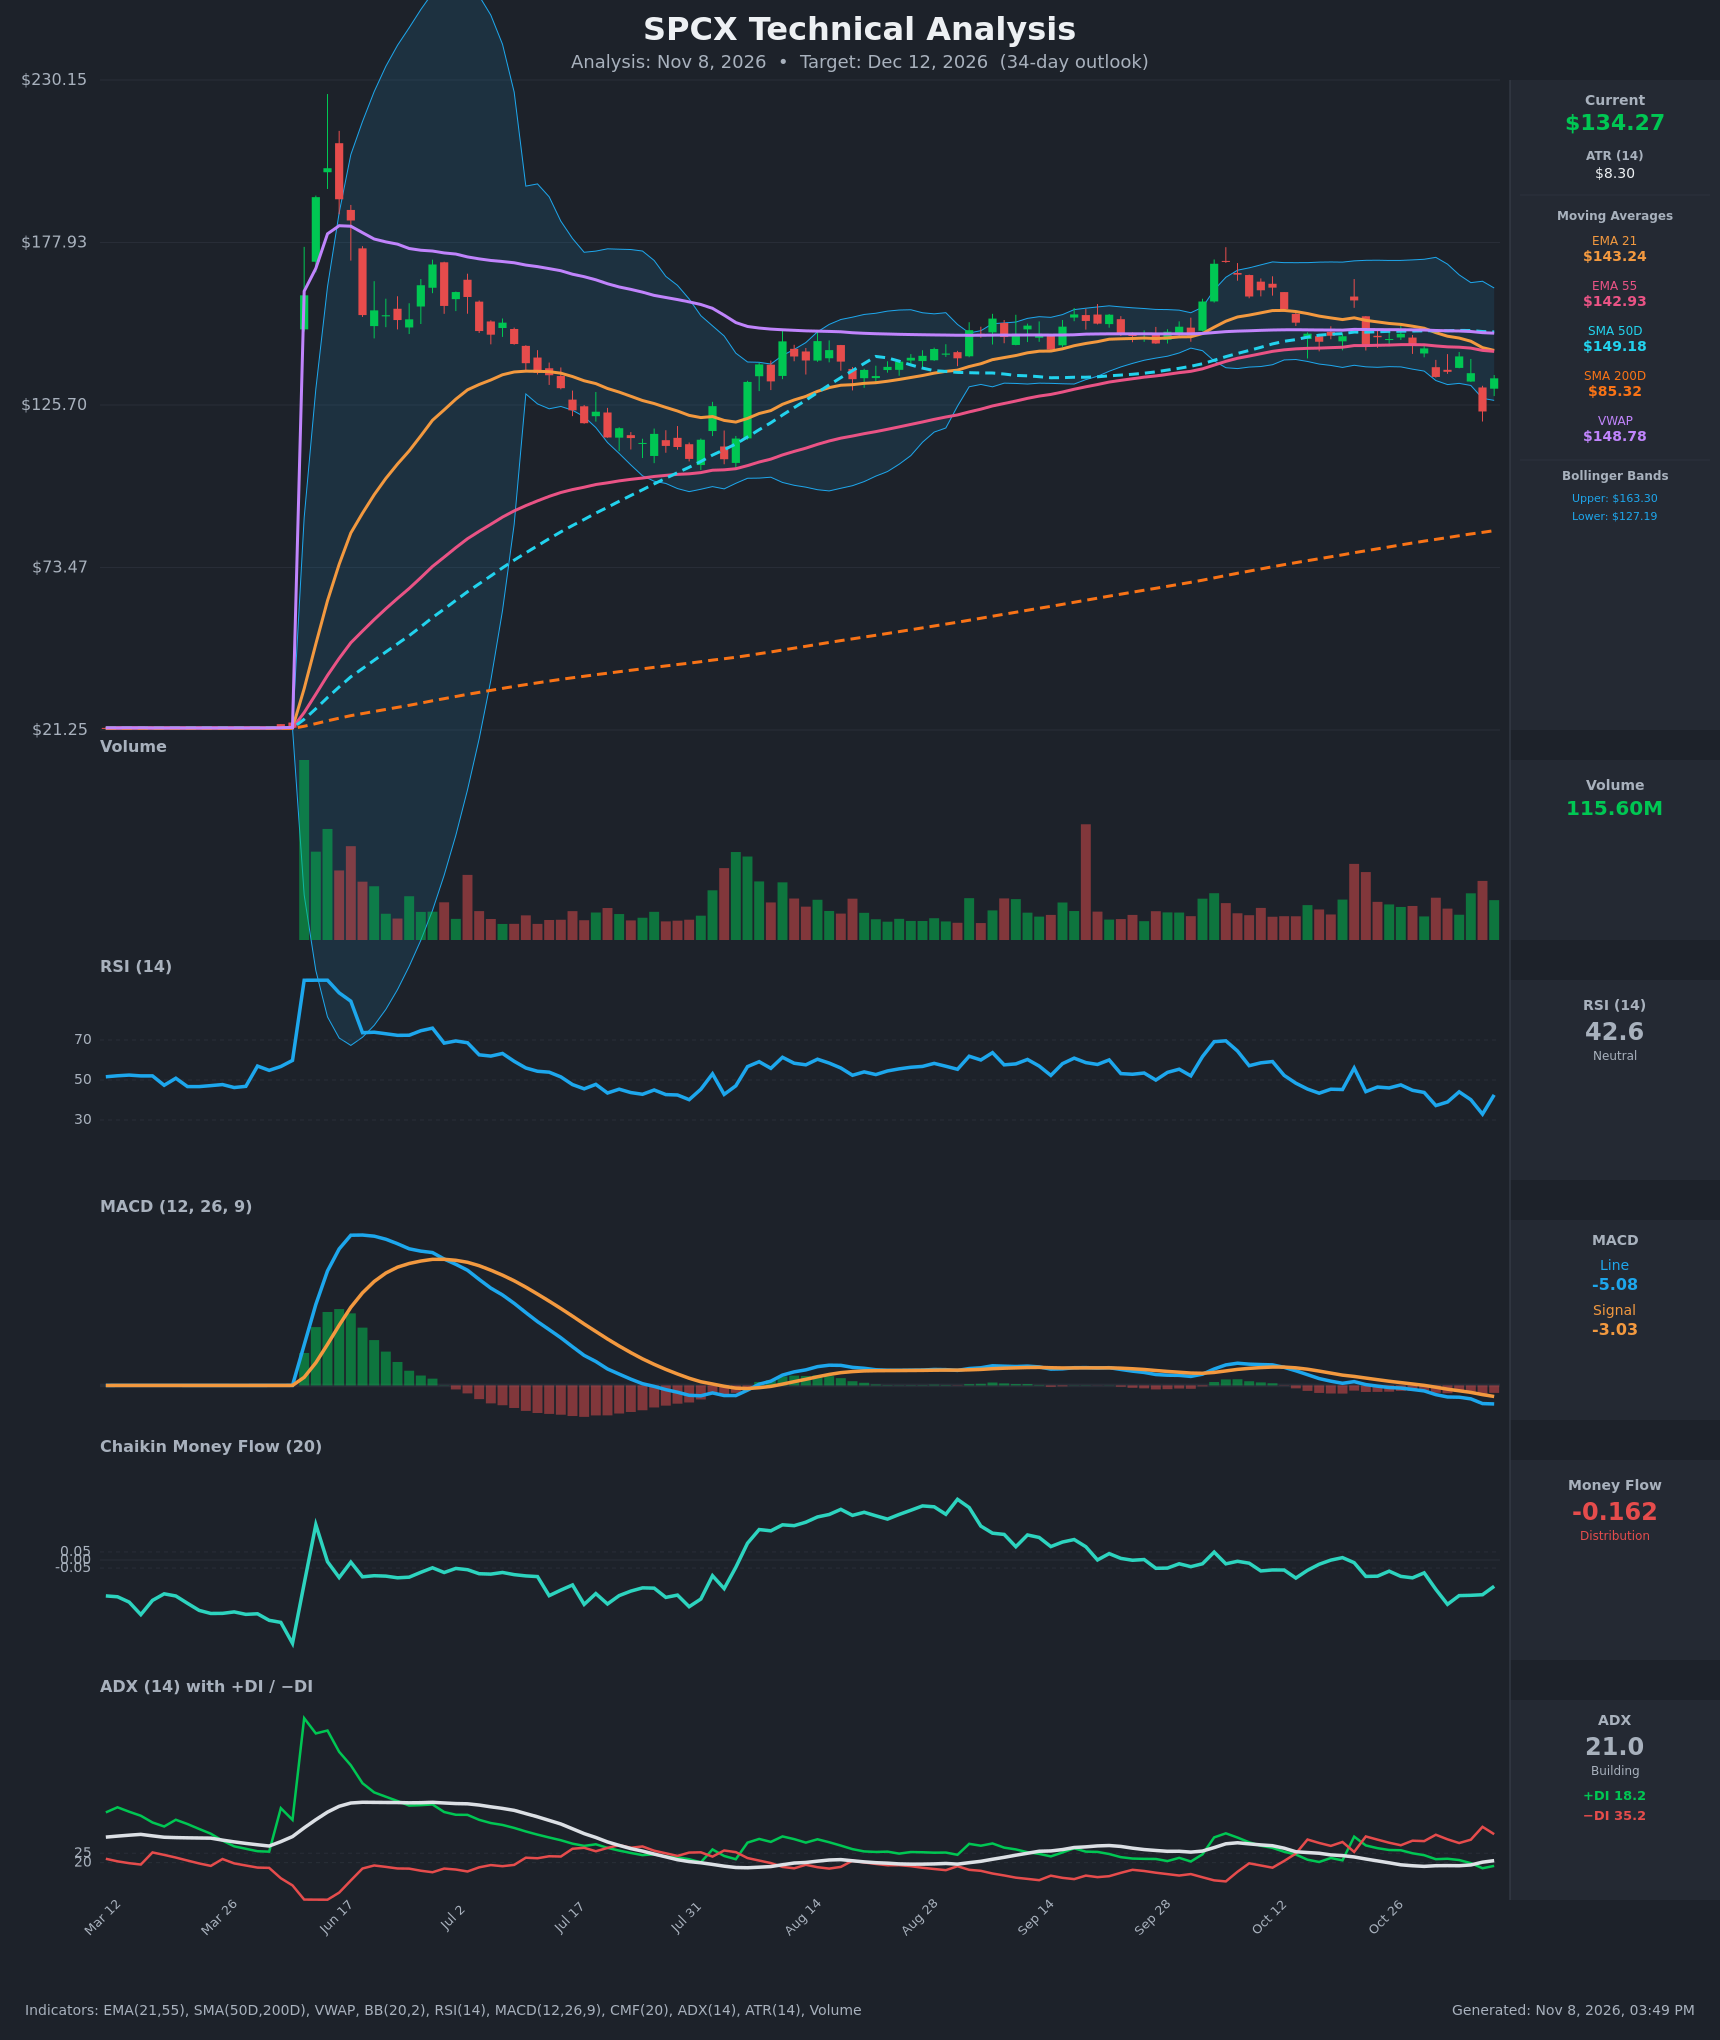
Analysis
TECHNICAL INDICATORS
- RSI (14): 42.56, bouncing from 32.9 (Nov 5) after a dip toward oversold. It is below 50 and has made lower highs since early October, so momentum is weak, but the latest bounce is a small relief. [Bearish]
- 20 EMA: The EMA 21 is $143.24 and price is $134.27, about 6% below it. The EMA 21 is sloping down and has just converged with the EMA 55 ($142.93), so it is overhead resistance. [Bearish]
- MACD: The line is -5.08 against a signal of -3.03, below the signal and below zero. The histogram is negative and widening, and the bearish crossover happened around Oct 30. [Bearish]
- Bollinger Bands (20): Upper is $163.30 and lower is $127.19, with a midline near $145. Price is in the lower third, having closed below the lower band at $123.62 on Nov 5 before snapping back inside. That is a mean-reversion bounce within a downtrend, not a trend reversal. [Neutral]
- CMF (20): -0.162, well below -0.05 and negative for several weeks, which means sustained distribution. [Distribution]
- ADX (14): 21.0, just above the 20 line and edging up. −DI (35.2) is far above +DI (18.2), so sellers control the direction even though the trend is not yet strong. [Weak-to-Building Trend, Bearish]
- Volume: 115.60M, elevated against recent averages. The heavy selling bars around Oct 30 and Nov 5 show conviction on the downside, and the latest bounce candle is on decent volume without clear follow-through yet. [Bearish-leaning / Distribution]
DIVERGENCES & TRENDS
- No clear bullish divergence. Price made a lower low on Nov 5 ($123.62) while RSI at 32.9 was well above the prior lows, but RSI has not yet confirmed with a higher low. This is only a tentative sign of selling exhaustion.
- MACD has crossed below its signal and is accelerating below zero, while the histogram keeps expanding. That confirms a bearish momentum trend.
- Price lost the EMA 21/55 cluster (about $143), the SMA 50D ($149.18) and VWAP ($148.78). All of these now sit overhead as a resistance band at $143–$149.
- The EMA 21 has crossed down toward the EMA 55, and a bearish EMA crossover is imminent.
- Price is far above the SMA200D ($85.32), so the long-term trend is still up. The stock is in a deep pullback from the post-IPO spike and the SMA 50D remains above the SMA 200D, with no death cross.
- Since September the price has formed lower highs ($170s, then $159.31, then $147-148), and DI favors sellers.
CHART PATTERNS
- Price has traced a broad range of roughly $135–$160 since August. It has now broken down through the lower side of that range and the sub-$140 area, which resembles a Bearish Expanding Triangle or a rolling-over top. The Oct 21 spike to $159 followed by lower closes fits a failed breakout and a Bearish Double Top shape around $159–$170, with the neckline near $135 now broken. The measured move from the double top points toward roughly $110–$120.
- A Descending Triangle is also plausible if the $123–$127 area holds as a floor with lower highs. A break below it would target the $105–$110 July lows.
- The $123.62 spike low and the lower Bollinger Band near $127 provide short-term support. The July low area around $105–$110 is the larger base.
POTENTIAL SCENARIOS
- Scenario 1: Bearish Continuation Lower — Sellers keep control (−DI 35 vs +DI 18, negative CMF, MACD below signal). The relief bounce stalls under the EMA 21/55 cluster near $143, and price retests and breaks the Nov 5 low. Trigger: rejection at $140–$143 or a close below $127. Target: $115–$120, with an extension to $110. Invalidation: daily close above $149 (SMA 50D/VWAP). (50% probability)
- Scenario 2: Neutral Range-Bound Chop — The oversold bounce holds above $123.62 and price oscillates between $123 and $145 as ADX stays near 20. Trigger: closes holding $127–$143. Target: $128–$140. Invalidation: close below $122 or above $150. (28% probability)
- Scenario 3: Bullish Recovery Rally — The Nov 5 flush proves a capitulation low, RSI makes a higher low, and price reclaims the EMA 21/55. Trigger: close above $144 on rising volume. Target: $149–$155 (SMA 50D/VWAP, then the mid-upper Bollinger Band). Invalidation: close back below $127. (22% probability)
PRICE TARGETS
- Target Price: $125.50 (34-day)
- Expected Range: $108.00 to $146.00 (width $38 ≈ 28% of current price, consistent with the 30–60 day guidance of roughly 12–18% extended by the stock's high ATR of $8.30 ≈ 6% daily)
- Key Levels: Support at $123.60 (Nov 5 low), Resistance at $143.20 (EMA 21/55 cluster)
OVERALL BIAS
OVERALL BIAS: BEARISH - Price sits below the EMA 21/55, SMA 50D and VWAP, with −DI far above +DI, a bearish MACD with an expanding negative histogram, and CMF at -0.162 showing persistent distribution. The current bounce looks like relief inside a downtrend, and the 34-day path favors a retest of the $123 low and a drift toward the low $120s.
This is educational analysis and not financial advice.