TLT 34-day bullish forecast — Nov 8, 2026
- Bias: Bullish
- Timeframe: 34 days (made Nov 8, 2026, target date Dec 11, 2026)
- Price at analysis: $81.92
- Price target: $83.60
- Expected range: $76.80 – $87.00
- Result: Pending — graded after the close on Dec 11, 2026
Get a free AI analysis of TLT today
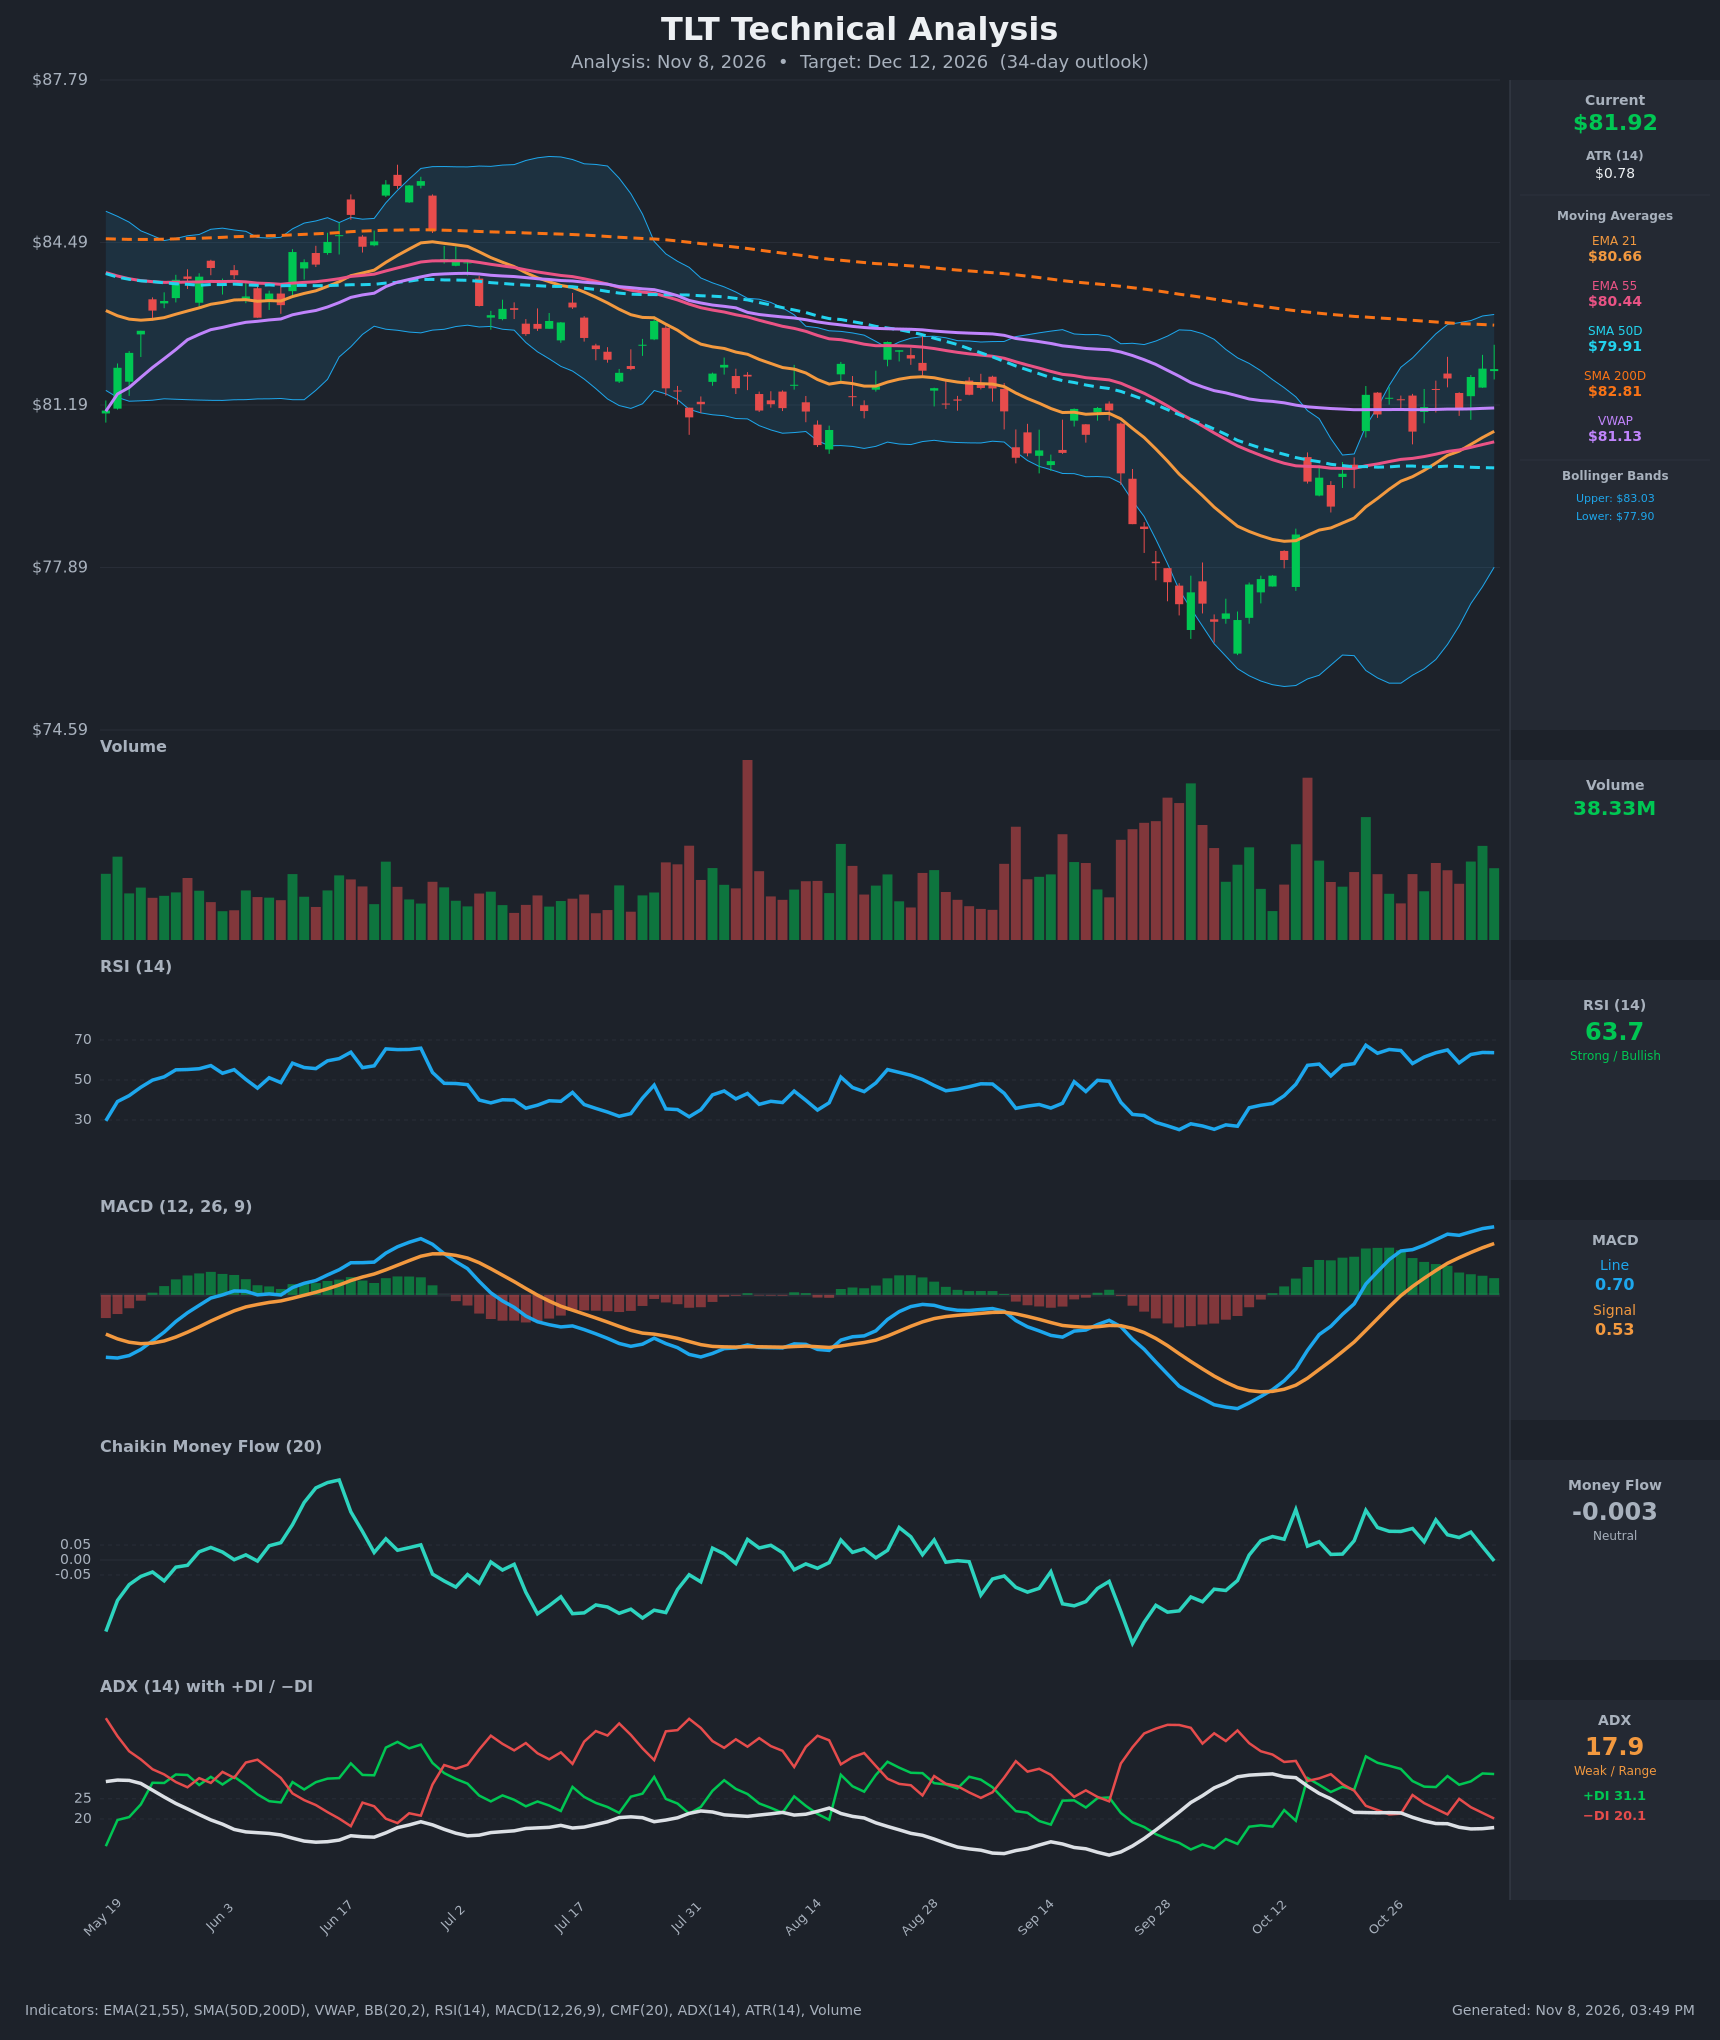
Analysis
TECHNICAL INDICATORS
- RSI (14): 63.66, in the upper-neutral/strong zone and below 70. It has held 58-67 for three weeks, which shows persistent buying without an overbought extreme. Momentum is flat to slightly positive. [Bullish]
- 20 EMA (EMA 21 = $80.66): Price at $81.92 is about 1.6% above the EMA 21, which is rising and acts as dynamic support. EMA 21 has also crossed above EMA 55 ($80.44), a short-term bullish crossover. [Bullish]
- MACD: The line (0.702) is above the signal (0.529), and both are positive and rising after the bullish crossover in late October. The histogram is +0.17 but has narrowed slightly from its peak, so momentum is positive but no longer accelerating. [Bullish]
- Bollinger Bands (20): Upper $83.03, lower $77.90, midline about $80.46. Price sits in the upper half of the bands, about $1.1 below the upper band. The bands are re-expanding after the September squeeze and the move off the low. [Bullish]
- CMF (20): -0.003, inside the ±0.05 neutral band and fading from +0.13 in late October. The rally is not being confirmed by strong accumulation. [Neutral]
- ADX (14): 17.9, below 20 and falling, so there is no established trend. +DI (31.1) is well above −DI (20.1), so bulls hold directional control, but the weak ADX argues for a grinding move rather than a strong trend. [Weak Trend + Bullish direction]
- Volume: 38.33M on a green bar, in line with the recent average. There are no obvious volume spikes on the recent advance, which is moderate and non-committal. The heaviest volume came in the September-October sell-off and capitulation low. [Neutral to mildly Bullish]
Other levels and moving averages:
- Price is above VWAP ($81.13), which is a mild buying-pressure signal.
- Price is above SMA50D ($79.91) but still below SMA200D ($82.81).
- SMA50D is below SMA200D, a standing death-cross configuration, so the long-term trend is still down.
DIVERGENCES & TRENDS
- There is no clear price/RSI divergence. RSI made a higher low during the October bounce and has tracked price.
- RSI and MACD are well off their September lows, and price has made a series of higher lows from the ~$76 bottom.
- CMF has rolled over from +0.13 to about zero while price holds near its highs. This is a mild warning that buying pressure is fading.
- The MACD histogram is narrowing slightly, a minor sign of momentum plateauing.
- ADX has fallen from about 25 to 17.9 as the DIs separated, so the trend is bullish but low in strength.
- EMA 21 crossed above EMA 55 (a bullish crossover). SMA50D remains well below SMA200D, so there is no golden cross.
- Price is approaching confluence resistance at SMA200D ($82.81) and the upper Bollinger Band ($83.03).
CHART PATTERNS
- The V-shaped recovery from ~$76 and the series of higher lows resemble a Bullish Falling Wedge or Inverted Head and Shoulders breakout from the September base. Neither is fully textbook.
- A Bullish Falling Wedge breakout measured from the wedge height would project toward the $84-85 area, near the June-July highs.
- The overhead SMA200D (~$82.81) and the $84.50 area are the major hurdles. The wedge/base breakout fails if price loses ~$80.4-80.7 (EMA 21/EMA 55).
- If price stalls beneath SMA200D and rolls over, a Double Top-style rejection near $82.5-83 is the bearish alternative.
POTENTIAL SCENARIOS
- Scenario 1: Bullish Breakout Above the 200-Day SMA — Price clears SMA200D and the upper Bollinger Band, supported by positive MACD and +DI dominance, and extends toward the prior June-July highs. Trigger: daily close above $83.05 on rising volume. Target: $84.50-$85.50. Invalidation: daily close below $80.40 (EMA 21/EMA 55 zone). (50% probability)
- Scenario 2: Neutral Range Consolidation — With ADX below 20 and CMF flat, price chops between the EMA 21 and SMA200D. Trigger: repeated rejections at $82.8-83.0 with support holding at $80.5-81. Target: $80.50-$83.00. Invalidation: close above $83.50 or below $80.00. (20% probability)
- Scenario 3: Bearish Rejection at Resistance — Price fails at SMA200D and the upper band, CMF turns negative, and the rally is unwound, with the death-cross structure reasserting itself. Trigger: bearish MACD histogram flip and close below $80.40. Target: $78.00-$79.50 (SMA50D at $79.91, then the lower band). Invalidation: close above $83.10. (30% probability)
PRICE TARGETS
- Target Price: $83.60 (34-day horizon, December 12, 2026)
- Expected Range: $76.80 to $87.00 (width $10.20, about 12.5% of the current price, consistent with the 30-60 day guidance)
- Key Levels: Support at $80.66 (EMA 21, followed by EMA 55 at $80.44 and SMA50D at $79.91), Resistance at $82.81 (SMA200D, with the upper Bollinger Band at $83.03 just above)
OVERALL BIAS
OVERALL BIAS: BULLISH - Price is above the rising EMA 21 and EMA 55 and above VWAP, MACD is positive and above its signal, and +DI dominates −DI, with higher lows since the September bottom. Conviction is modest because ADX is weak, CMF is neutral, and price faces SMA200D/upper-band resistance with the SMA50D/SMA200D death-cross structure still intact.
This is educational analysis and not financial advice.