TSLA 34-day bearish forecast — Nov 8, 2026
- Bias: Bearish
- Timeframe: 34 days (made Nov 8, 2026, target date Dec 11, 2026)
- Price at analysis: $358.22
- Price target: $345.00
- Expected range: $305.00 – $383.00
- Result: Pending — graded after the close on Dec 11, 2026
Get a free AI analysis of TSLA today
Analysis
TECHNICAL INDICATORS
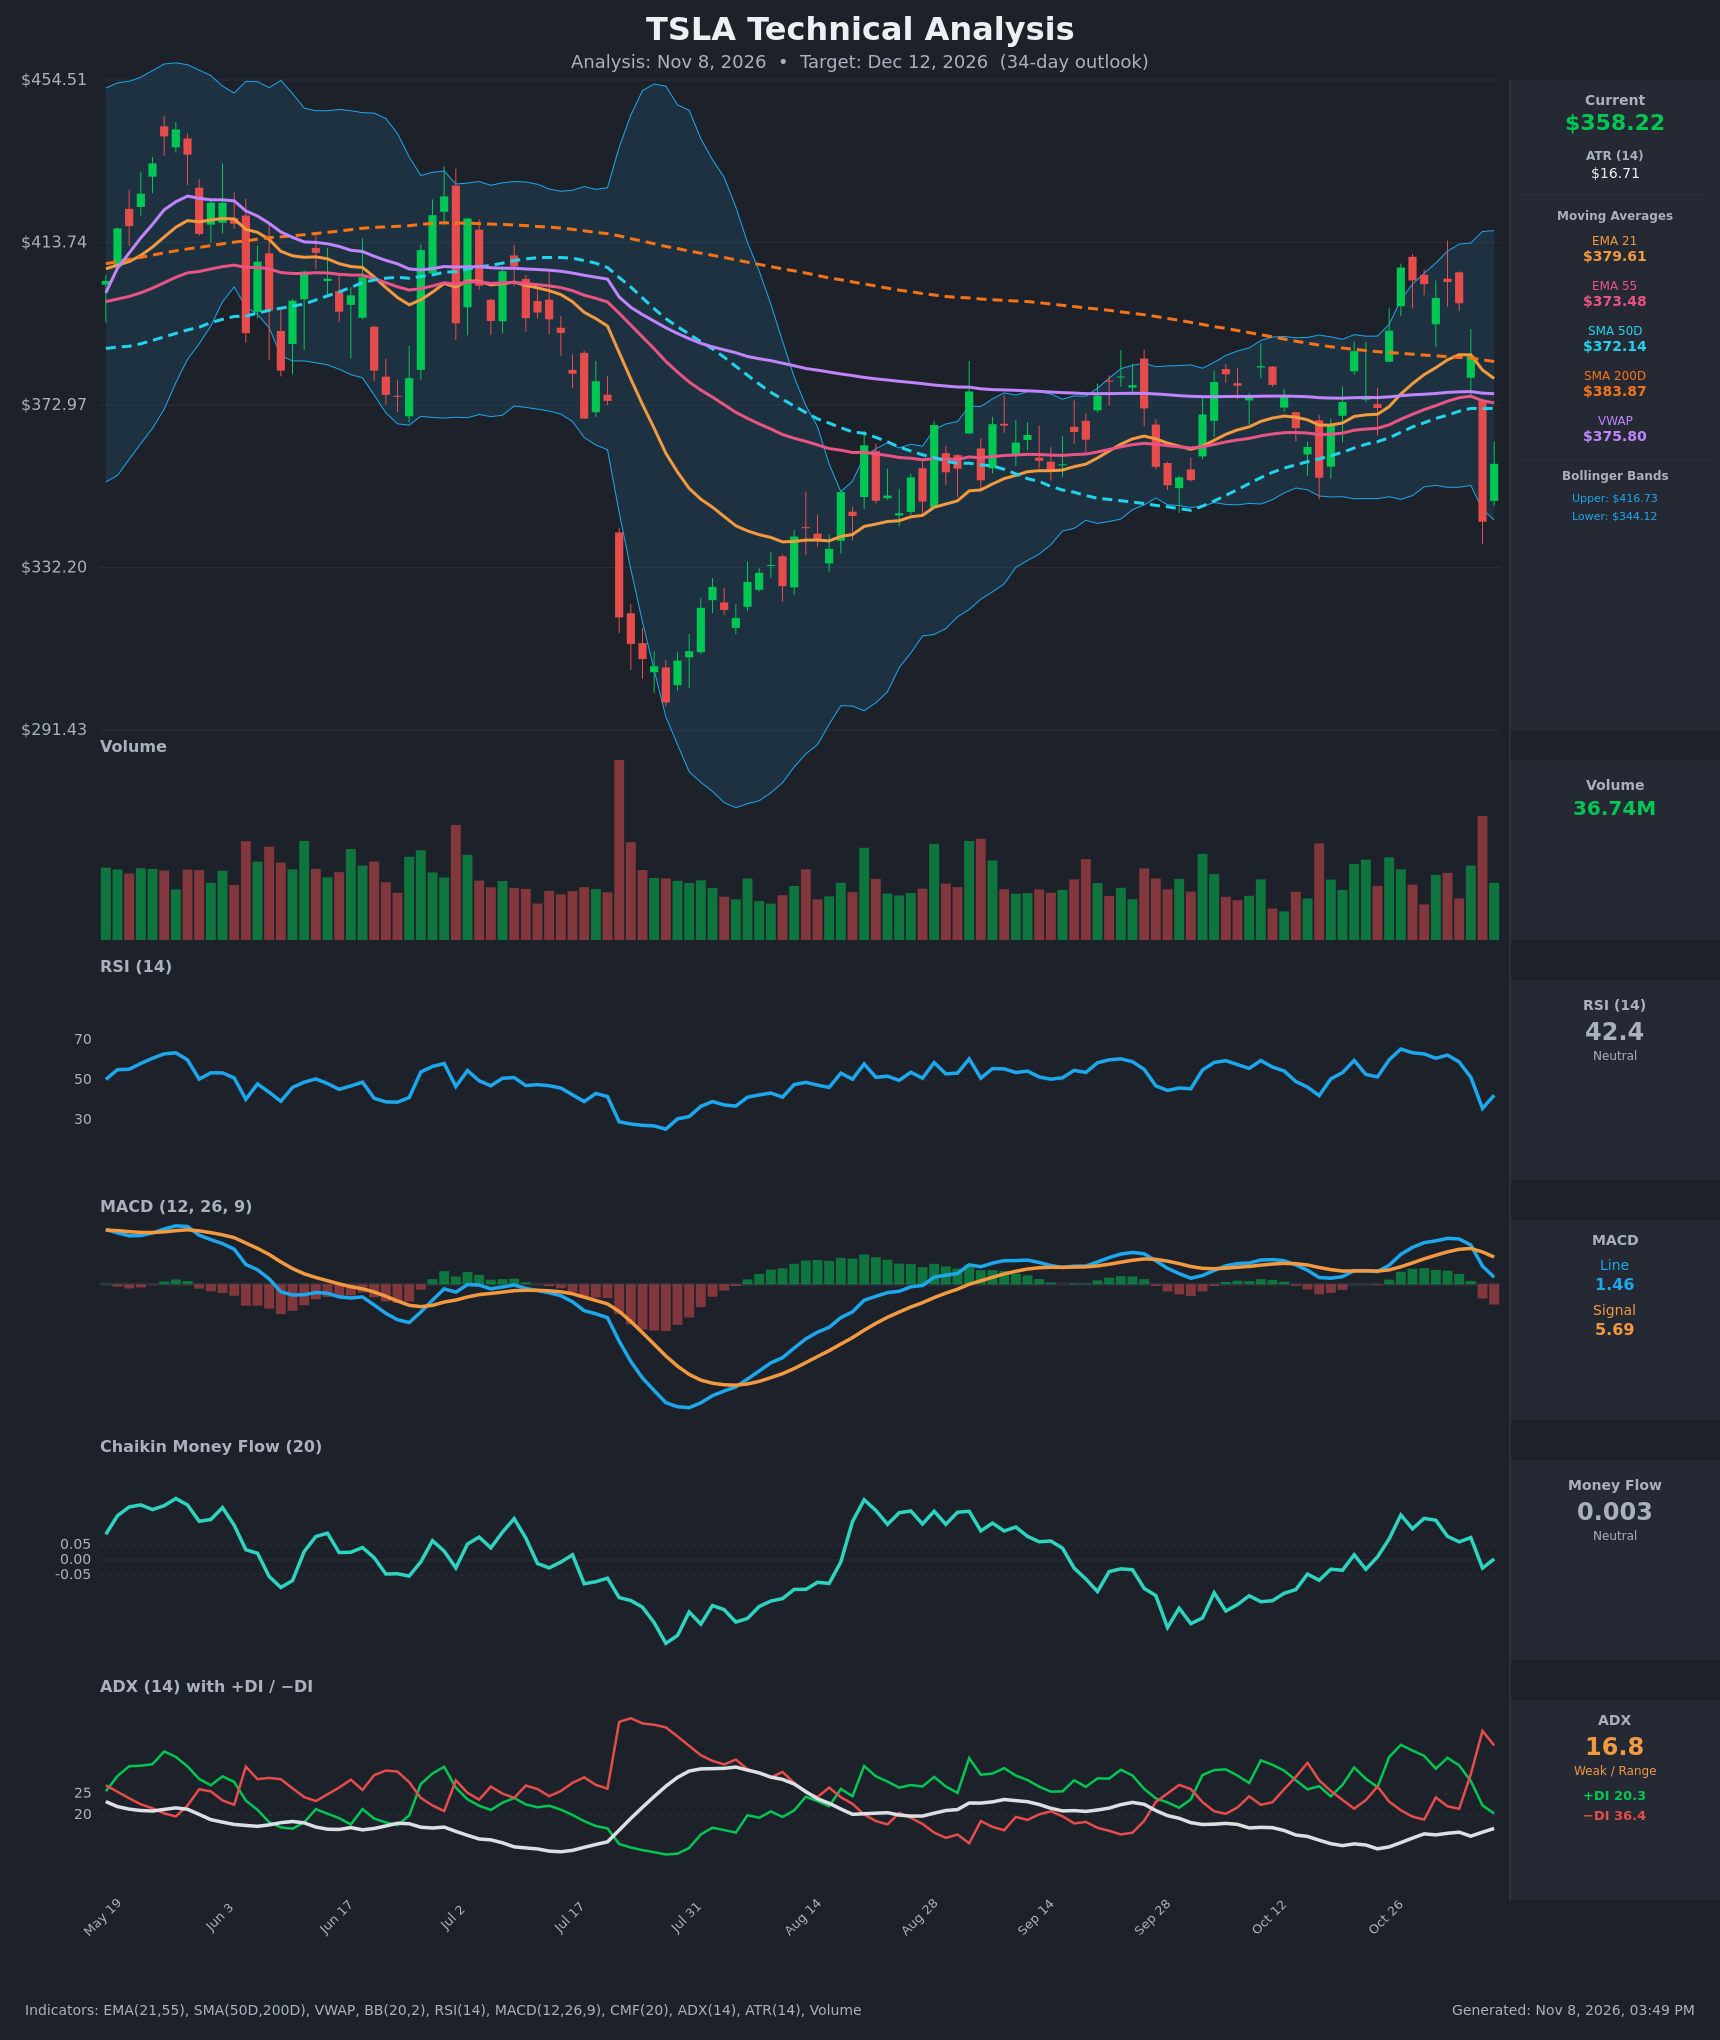
- RSI (14): 42.39, down sharply from 62.5 on Nov 2 and a low of 35.8 on Nov 5. It bounced slightly but remains below 50, so momentum has shifted bearish. It is not yet oversold. [Bearish]
- 20 EMA: The EMA 21 is $379.61 and price at $358.22 sits about 5.6% below it. The EMA is rolling over (385.59 → 379.61), so it acts as overhead resistance. EMA 21 is still above EMA 55 ($373.48), but the gap is narrowing quickly. [Bearish]
- MACD: Line 1.464 is below Signal 5.689, a bearish crossover that occurred on Nov 5. The histogram is negative (about -4.2) and the line is falling toward zero. [Bearish]
- Bollinger Bands (20): Upper $416.73, lower $344.12, midline roughly $380. Price is in the lower third of the bands after a big drop from $385 to $344 and a partial bounce. Bands are moderately wide and there is no squeeze. The close at $358 is above the lower band, so the downside bounce is unconfirmed. [Bearish]
- CMF (20): 0.003, inside the neutral zone (±0.05). It fell from +0.07–0.15 in late October, so buying pressure has faded without yet turning into distribution. [Neutral]
- ADX (14): 16.8 (weak/range-bound) but edging up from 15.0. −DI 36.4 is well above +DI 20.3, and the DI cross on Nov 4 favors bears. A rising ADX with −DI on top would signal developing downside trend strength. [Weak Trend, Bearish Direction]
- Volume: 36.74M on the latest bar, and the Nov 5 breakdown candle came on the heaviest volume in several weeks (a visible spike). Selling on expansion volume points to distribution, and the bounce on Nov 6 came on lighter volume. [Bearish]
DIVERGENCES & TRENDS
- No clear bullish or bearish divergence. RSI and MACD both confirmed the price drop.
- Price has fallen below the EMA 21, EMA 55, SMA 50D ($372.14), VWAP ($375.80) and SMA 200D ($383.87). It sits below all of them, so the short-term trend is bearish.
- The Nov 5 candle (-10.8%) was a large bearish engulfing bar that reversed the Oct 26-Nov 3 rally to the $400 area and failed at the $404-407 resistance.
- SMA 50D ($372.14) remains below SMA 200D ($383.87), so there is no golden cross. The gap is narrowing but price is capped below both.
- MACD signal-line crossover is bearish, and DI shows bears in control. The CMF drift to zero shows fading demand.
- Price has been mostly range-bound between about $345 and $410 since August, a broad multi-month base around $370. The recent failure at the top of that range and a drop back toward the lower half favor a retest of the lower band/range low near $344.
CHART PATTERNS
- Bearish Double Top (loose): Highs at about $407 (Oct 27) and about $404 (Nov 2) with a breakdown through the neckline around the $385 area. The measured move (neckline $385 minus peak-to-neckline height of about $22) implies roughly $345-$355, which has largely been reached already.
- Broader range: Since August price has oscillated roughly $345-$410, with the recent bounce attempting to hold the lower range. A break below $344 would target the $332 and then $310-$320 area.
- No bullish reversal pattern is confirmed. A reclaim of $380 (EMA 21/SMA 200D cluster) would be needed to negate the bearish setup.
POTENTIAL SCENARIOS
- Scenario 1: Bearish Continuation Lower — Price fails at the $365-$375 cluster (EMA 55, SMA 50D, VWAP), MACD stays below signal, and −DI stays dominant. Price retests the lower Bollinger Band and the Nov 5 low. Trigger: rejection below $373 or a daily close below $344. Target: $330-$340, with extension to $320. Invalidation: daily close above $380. (50% probability)
- Scenario 2: Neutral Range-Bound Chop — With ADX at 16.8, price oscillates between $340 and $380 as the market digests the drop. Trigger: failure to break $344 or $375. Target: $350-$370. Invalidation: close outside the $335-$385 range. (28% probability)
- Scenario 3: Bullish Recovery — Price reclaims the EMA 21 and SMA 200D after a V-shaped rebound. Trigger: close above $380 with volume. Target: $395-$405. Invalidation: close below $344. (22% probability)
PRICE TARGETS
For the 34-day horizon (to about Dec 12, 2026):
- Target Price: $345.00
- Expected Range: $305.00 to $383.00 (width $78 = about 21.8% of current price, consistent with the 18-30% guidance for a 34-day-to-60-day timeframe, leaning toward the 12-18% band given a 34-day horizon; ATR of $16.7 supports a wide range)
- Key Levels: Support at $344.00, Resistance at $373.50
OVERALL BIAS
OVERALL BIAS: BEARISH - Price broke below every major moving average on heavy volume, MACD crossed bearishly, and −DI dominates +DI with RSI below 50. Price faces overhead resistance at $373-$384, so a retest of the $344 lower band and possibly lower is more likely than a recovery.
This is educational analysis and not financial advice.