WMT 34-day bullish forecast — Nov 8, 2026
- Bias: Bullish
- Timeframe: 34 days (made Nov 8, 2026, target date Dec 11, 2026)
- Price at analysis: $125.52
- Price target: $128.50
- Expected range: $117.50 – $135.00
- Result: Pending — graded after the close on Dec 11, 2026
Get a free AI analysis of WMT today
Analysis
TECHNICAL INDICATORS
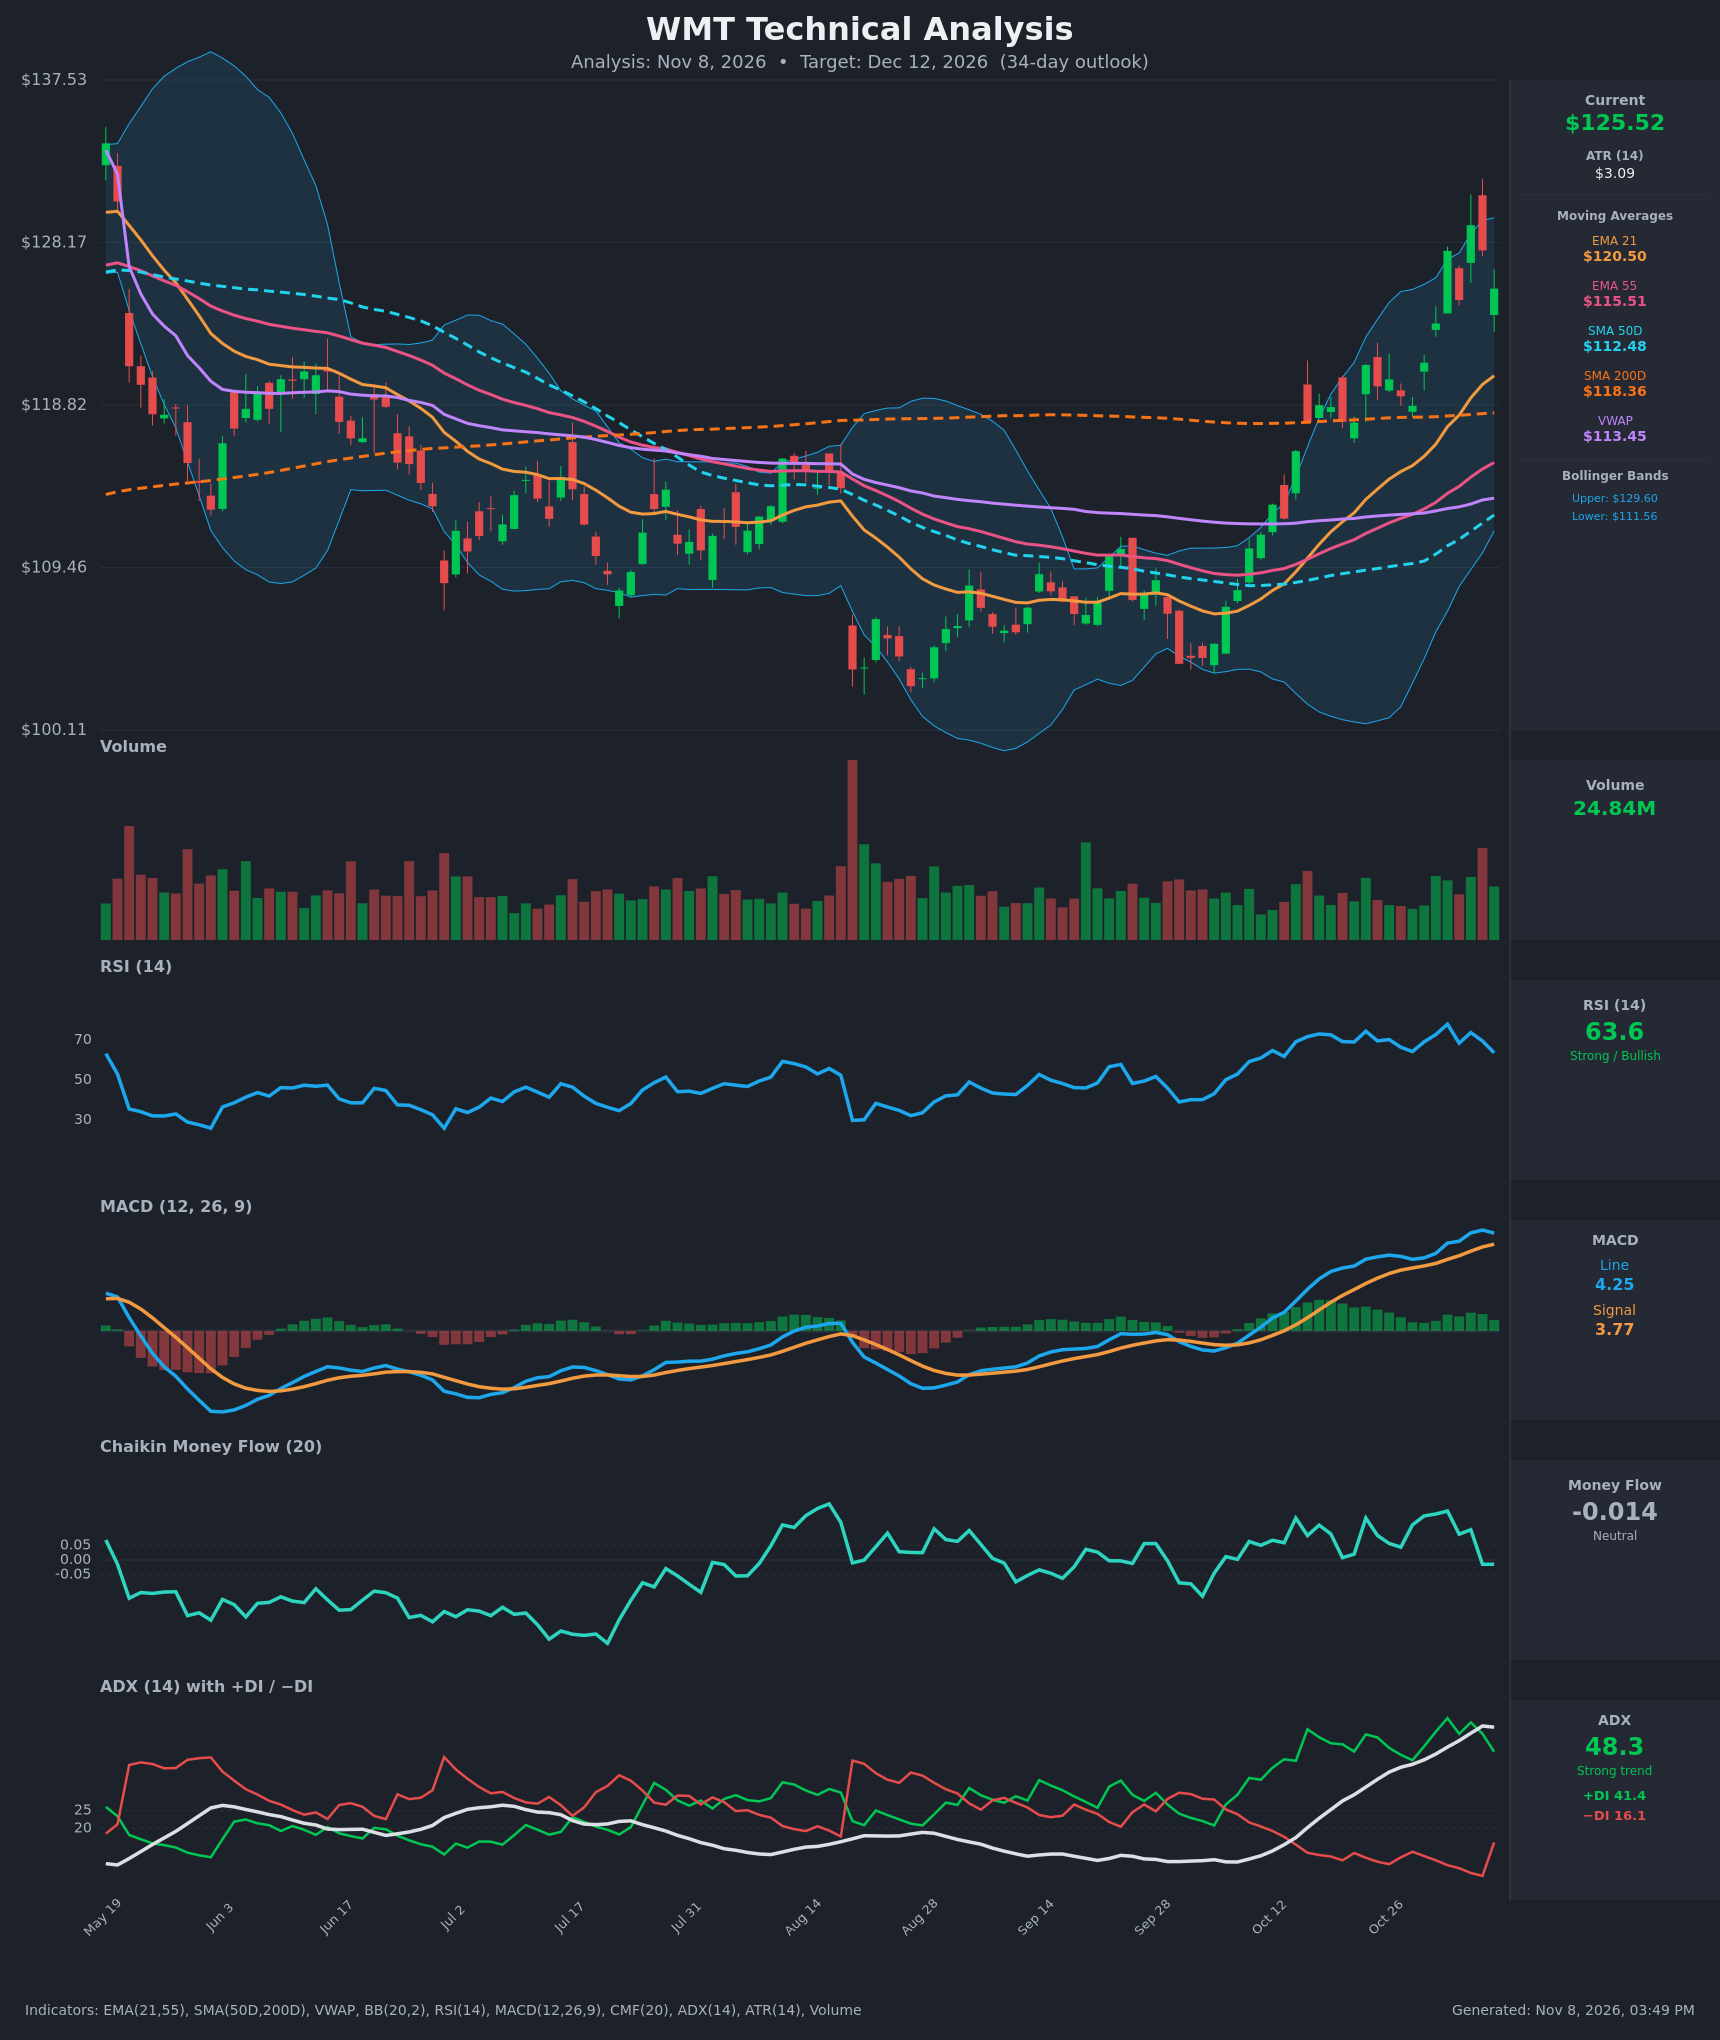
- RSI (14): 63.6, down from a 77.9 peak on Nov 2 and 73.7 on Nov 4. It is cooling from overbought while holding above 50. Momentum is fading but the trend regime is still bullish. [Neutral]
- 20 EMA: The 21 EMA is $120.50 and rising, with price about 4% above it. The 21 EMA is above the 55 EMA ($115.51), and both slope up. The 21 EMA is the first dynamic support on a pullback. [Bullish]
- MACD: Line 4.25 is above signal 3.77, so there is no bearish cross. The histogram shrank from +0.73 to +0.48 and the line ticked down from 4.38, an early sign of momentum loss. [Bullish]
- Bollinger Bands (20): Upper $129.60, lower $111.56, midline about $120.58. Price is at roughly 77% of the band range, after tagging the upper band at $129.17 on Nov 4 and pulling back. The bands are wide and expanding, which fits a trending market. [Bullish]
- CMF (20): -0.014, in the neutral zone. It fell from +0.168 (Nov 2) to slightly negative while price made a higher high at $129.17. This is a mild distribution warning. [Neutral]
- ADX (14): 48.3, a very strong trend, but it has flattened (48.6 → 48.3). +DI is 41.4, down from 50.8, and −DI jumped from 6.7 to 16.1. Bulls are still in control, but readings this high often come near trend exhaustion or consolidation. [Strong Trend, Bullish, with fading +DI]
- Volume: 24.84M, near average. The recent pullback bars carried heavier volume than the quiet advance days, a slight negative. The early-October breakout had good participation. [Neutral to slightly cautious]
DIVERGENCES & TRENDS
- CMF divergence: Price made a higher high ($129.17) while CMF peaked on Nov 2 and has since rolled over to -0.014. This is a mild bearish divergence.
- RSI: It made a lower high (77.9 → 73.7) while price made a higher high (127.69 → 129.17). This is another mild bearish divergence, so momentum is lagging price.
- MACD: The histogram peaked on Nov 5 and is now contracting, but there is no signal-line cross yet.
- Moving averages: The 21 EMA crossed above the 55 EMA earlier and the gap is widening. Price is above SMA200 ($118.36) and the SMA50 ($112.48) is closing in on it, but the golden cross has not happened.
- VWAP: Price is far above VWAP ($113.45), a sign of strong trend control but also stretched.
- DI: +DI remains well above −DI, but the −DI uptick and +DI decline show early selling pressure.
CHART PATTERNS
- Bullish Flag / consolidation after an impulse: The rally from about $108 to $129 is followed by a shallow pullback. If it holds above the $120–121 area, the flag measured move projects toward $135 or higher.
- Possible Bearish Double Top: Peaks of $127.69 and $129.17 are not equal, so this is only a loose match. A close below roughly $124 (the Nov 3 low) would strengthen it, with a target near $118–120 (the neckline-to-EMA21/SMA200 zone).
- Overall: The pattern read is mixed, with trend continuation favored over reversal, but near-term digestion is likely.
POTENTIAL SCENARIOS
- Scenario 1: Bullish Pullback-and-Continue — Price digests the rally, retests the rising 21 EMA near $120.50–122, then resumes higher as the ADX trend persists. Trigger: Hold above $120.50 and a close above $129.20. Target: $128.50–$135. Invalidation: Daily close below $118.40 (SMA200). (50% probability)
- Scenario 2: Bearish Momentum-Fade Reversal — RSI and CMF divergences resolve downward, a double top forms near $129, and the high ADX marks exhaustion. Trigger: Close below $124 with a MACD bearish cross. Target: $118–$120, then possibly $115.50 (55 EMA). Invalidation: Close above $129.60 (upper band). (30% probability)
- Scenario 3: Neutral Consolidation — Price chops between the 21 EMA and the recent high. Trigger: Failed breakouts on either side with falling ADX. Target: $121–$129. Invalidation: Close outside that range on strong volume. (20% probability)
PRICE TARGETS
- Target Price: $128.50 (34-day)
- Expected Range: $117.50 to $135.00. The width is $17.50, about 13.9% of the current price, which fits the 30–60 day guidance of 12–18%.
- Key Levels: Support at $120.50 (21 EMA), Resistance at $129.17 (recent high, near the upper Bollinger Band)
OVERALL BIAS
OVERALL BIAS: BULLISH - The trend is very strong (ADX 48, +DI far above −DI), price is above all key moving averages, and MACD remains above its signal. The RSI and CMF divergences suggest a pullback toward the $120–122 area first, but the 34-day path favors a higher close near $128.50.
This is educational analysis and not financial advice.