XLE 34-day bearish forecast — Nov 8, 2026
- Bias: Bearish
- Timeframe: 34 days (made Nov 8, 2026, target date Dec 11, 2026)
- Price at analysis: $61.62
- Price target: $60.20
- Expected range: $56.50 – $65.50
- Result: Pending — graded after the close on Dec 11, 2026
Get a free AI analysis of XLE today
Analysis
TECHNICAL INDICATORS
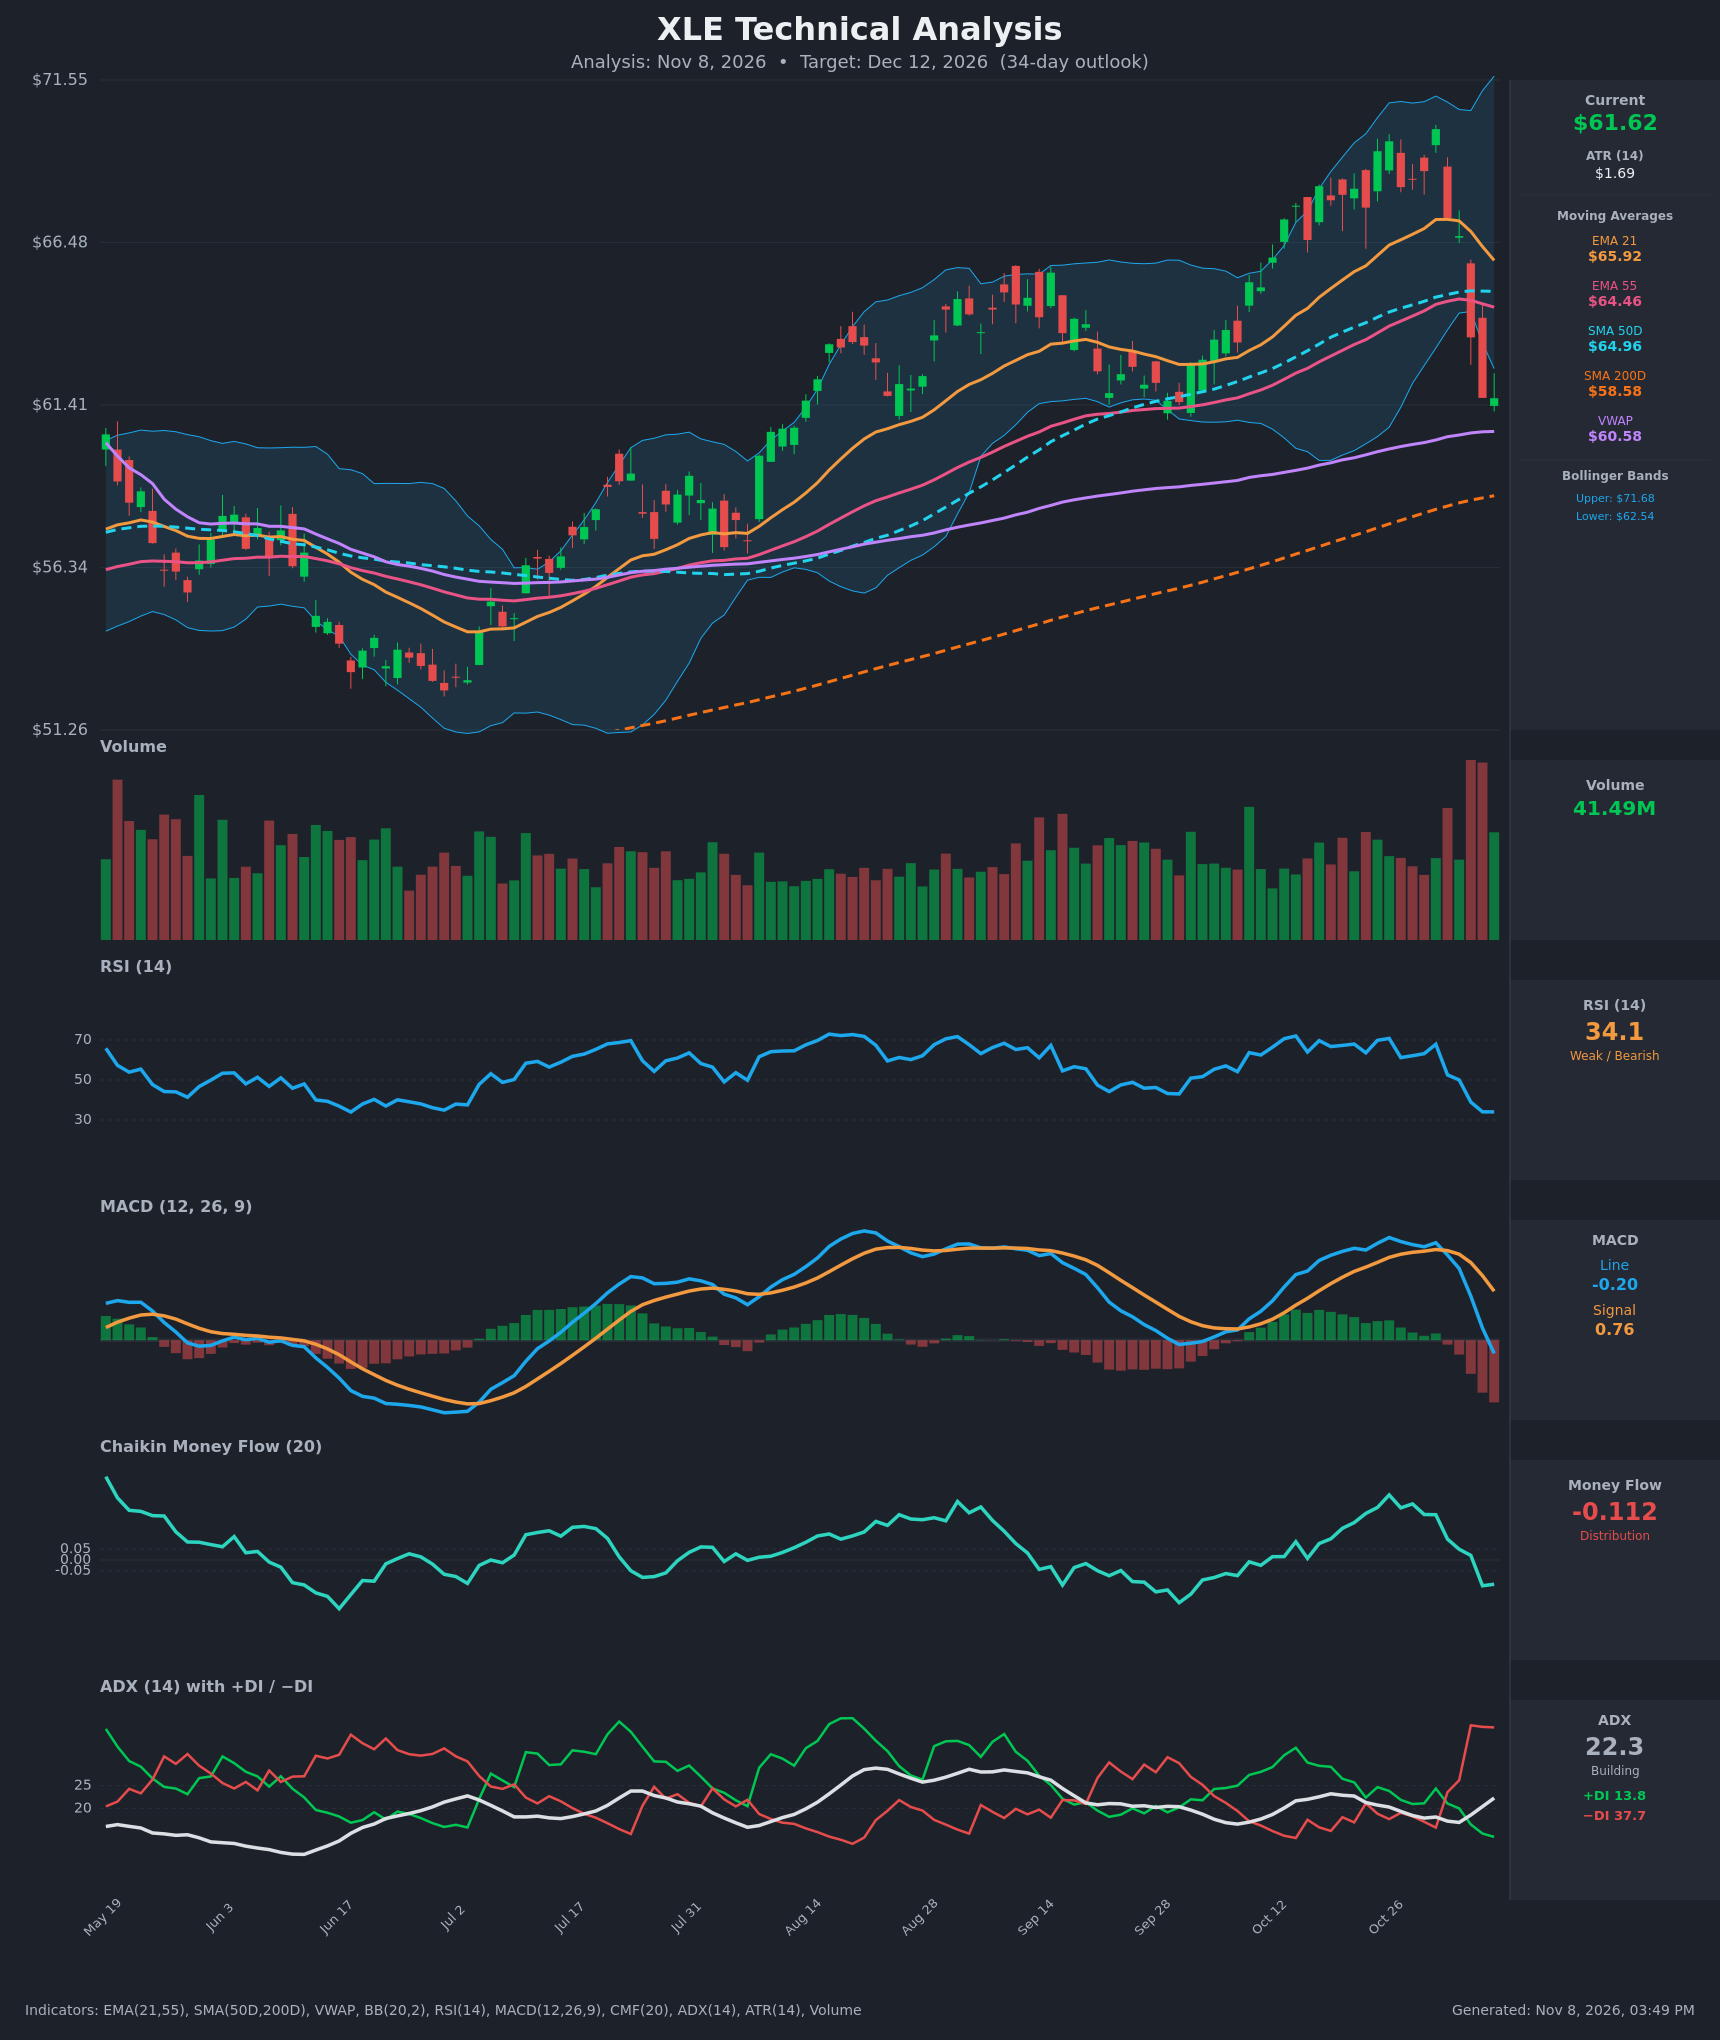
- RSI (14): 34.06, down from 70.8 on Oct 26 and flat for the last two bars. It sits just above oversold (30) and has made lower highs since late October. Momentum is clearly bearish, with a bounce possible given how stretched it is. [Bearish]
- 20 EMA: The EMA 21 is $65.92 and falling, and price at $61.62 is about 6.5% below it. It acts as overhead resistance. The EMA 21 is converging on the EMA 55 ($64.46), so a bearish EMA cross is close. [Bearish]
- MACD: The line is -0.203 and the signal is 0.758. The bearish crossover happened on Nov 6 (the Nov 3 reading was 1.110 vs 1.331 and the gap has widened since). The histogram is increasingly negative and the line has dropped below zero. [Bearish]
- Bollinger Bands (20): The upper band is $71.68 and the lower is $62.54. Price at $61.62 is below the lower band after a sharp expansion from the upper half of the band. This is a stretched, oversold reading that often brings a relief bounce. A sustained "band walk" would mean continuation, and the mean (about $67) is far above. [Bearish]
- CMF (20): -0.112, down from +0.30 on Oct 26, and below the -0.05 threshold. The shift to distribution happened in just a few sessions and confirms real selling pressure. [Distribution]
- ADX (14): 22.3 and rising from 17, with +DI at 13.8 and −DI at 37.7. The −DI is far above the +DI, so sellers are firmly in control. ADX is just under the 25 "strong trend" line, but the DI spread is wide and the trend is strengthening. [Strengthening Trend – Bearish]
- Volume: 41.49M on the latest bar, after two of the highest-volume bars of the whole chart (the red candles on Nov 4–5). Heavy volume on the breakdown suggests institutional distribution rather than a drift. Volume is fading slightly on the last candle, which hints at short-term exhaustion. [Bearish – high-volume breakdown]
DIVERGENCES & TRENDS
- There is no bullish RSI or MACD divergence yet. RSI and MACD are both confirming the lower price.
- RSI made a lower high at the Oct 26–30 price highs (70.8, then 67.9), while price made a marginal new high of $70.02. That is a mild bearish divergence that preceded the drop.
- CMF peaked in late October and rolled over sharply. It crossed below zero and then below -0.05, which confirmed the selling.
- MACD crossed bearish on Nov 6 and is now negative.
- −DI crossed above +DI on Nov 2 and has widened since.
- Price closed below the EMA 21, the EMA 55 and the SMA 50 (about $64.96) within a few sessions. This is a break of the entire short- and medium-term structure.
- Price is still above the SMA 200 ($58.58, rising) and slightly above VWAP ($60.58). That is the main remaining long-term support, and it keeps the decline from being a full trend reversal.
- The SMA 50 remains above the SMA 200, so there is no death cross.
CHART PATTERNS
- Bearish Double Top: Highs near $69.64 (Oct 26) and $70.02 (Oct 30) were followed by a sharp breakdown through the ~$66.7–68 area. The measured move is largely complete, since price has already fallen beyond the pattern's height.
- Rejection at the upper Bollinger Band: After a strong run-up, the sharp reversal looks like a blow-off top, similar to a Bearish Rising Wedge breakdown.
- Broader range: Since August the chart has traded in a roughly $56–$70 band. The SMA 200 near $58.6 and the Sep–Oct base around $61–62 form the next support zone.
- Reference diagram: The nearest match is the Bearish Double Top. A failed relief rally back to the $64–65 breakdown area would resemble a bearish flag or pennant continuation.
POTENTIAL SCENARIOS
- Scenario 1: Bearish Continuation Toward the 200-Day — Price fails to reclaim the broken moving averages and drifts lower as −DI stays dominant and CMF remains negative. Trigger: a daily close below the VWAP at $60.58 and the Sep–Oct low area around $61. Target: $58.50–$59.50 (SMA 200), with an extension to about $56.50. Invalidation: a daily close above $64.50 (EMA 55). (50% probability)
- Scenario 2: Bullish Oversold Relief Bounce — RSI near 30 and a close below the lower band set up a mean-reversion rally that fills part of the gap down. Trigger: a close back above $62.54 (lower BB) with CMF turning up. Target: $64.50–$65.90 (EMA 55 / EMA 21 / SMA 50 cluster). Invalidation: a close below $60.00. (35% probability)
- Scenario 3: Neutral Consolidation — Price stabilizes between the VWAP and the lower band while ADX stays near 20–22. Trigger: several sessions of tight closes between $60.50 and $63. Target: about $61–$63. Invalidation: a close outside $59.50–$64.00. (15% probability)
PRICE TARGETS
- Target Price: $60.20 (34-day horizon)
- Expected Range: $56.50 to $65.50 (width $9.00, about 14.6% of the current price, consistent with the 30–60 day guidance of 12–18%)
- Key Levels: Support at $60.58 (VWAP), Resistance at $64.46 (EMA 55). Secondary support is $58.58 (SMA 200) and secondary resistance is $62.54 (lower BB).
OVERALL BIAS
OVERALL BIAS: BEARISH - Price broke below the EMA 21, EMA 55 and SMA 50 on heavy volume, MACD crossed bearish, −DI (37.7) dominates +DI (13.8), and CMF shows distribution. An oversold bounce toward $64–65 is possible, but the path of least resistance is a retest of the VWAP and SMA 200 zone.
This is educational analysis and not financial advice.