TQQQ 34-day bearish forecast — Nov 8, 2026
- Bias: Bearish
- Timeframe: 34 days (made Nov 8, 2026, target date Dec 11, 2026)
- Price at analysis: $52.25
- Price target: $49.00
- Expected range: $45.00 – $54.00
- Result: Pending — graded after the close on Dec 11, 2026
Get a free AI analysis of TQQQ today
Analysis
TECHNICAL INDICATORS
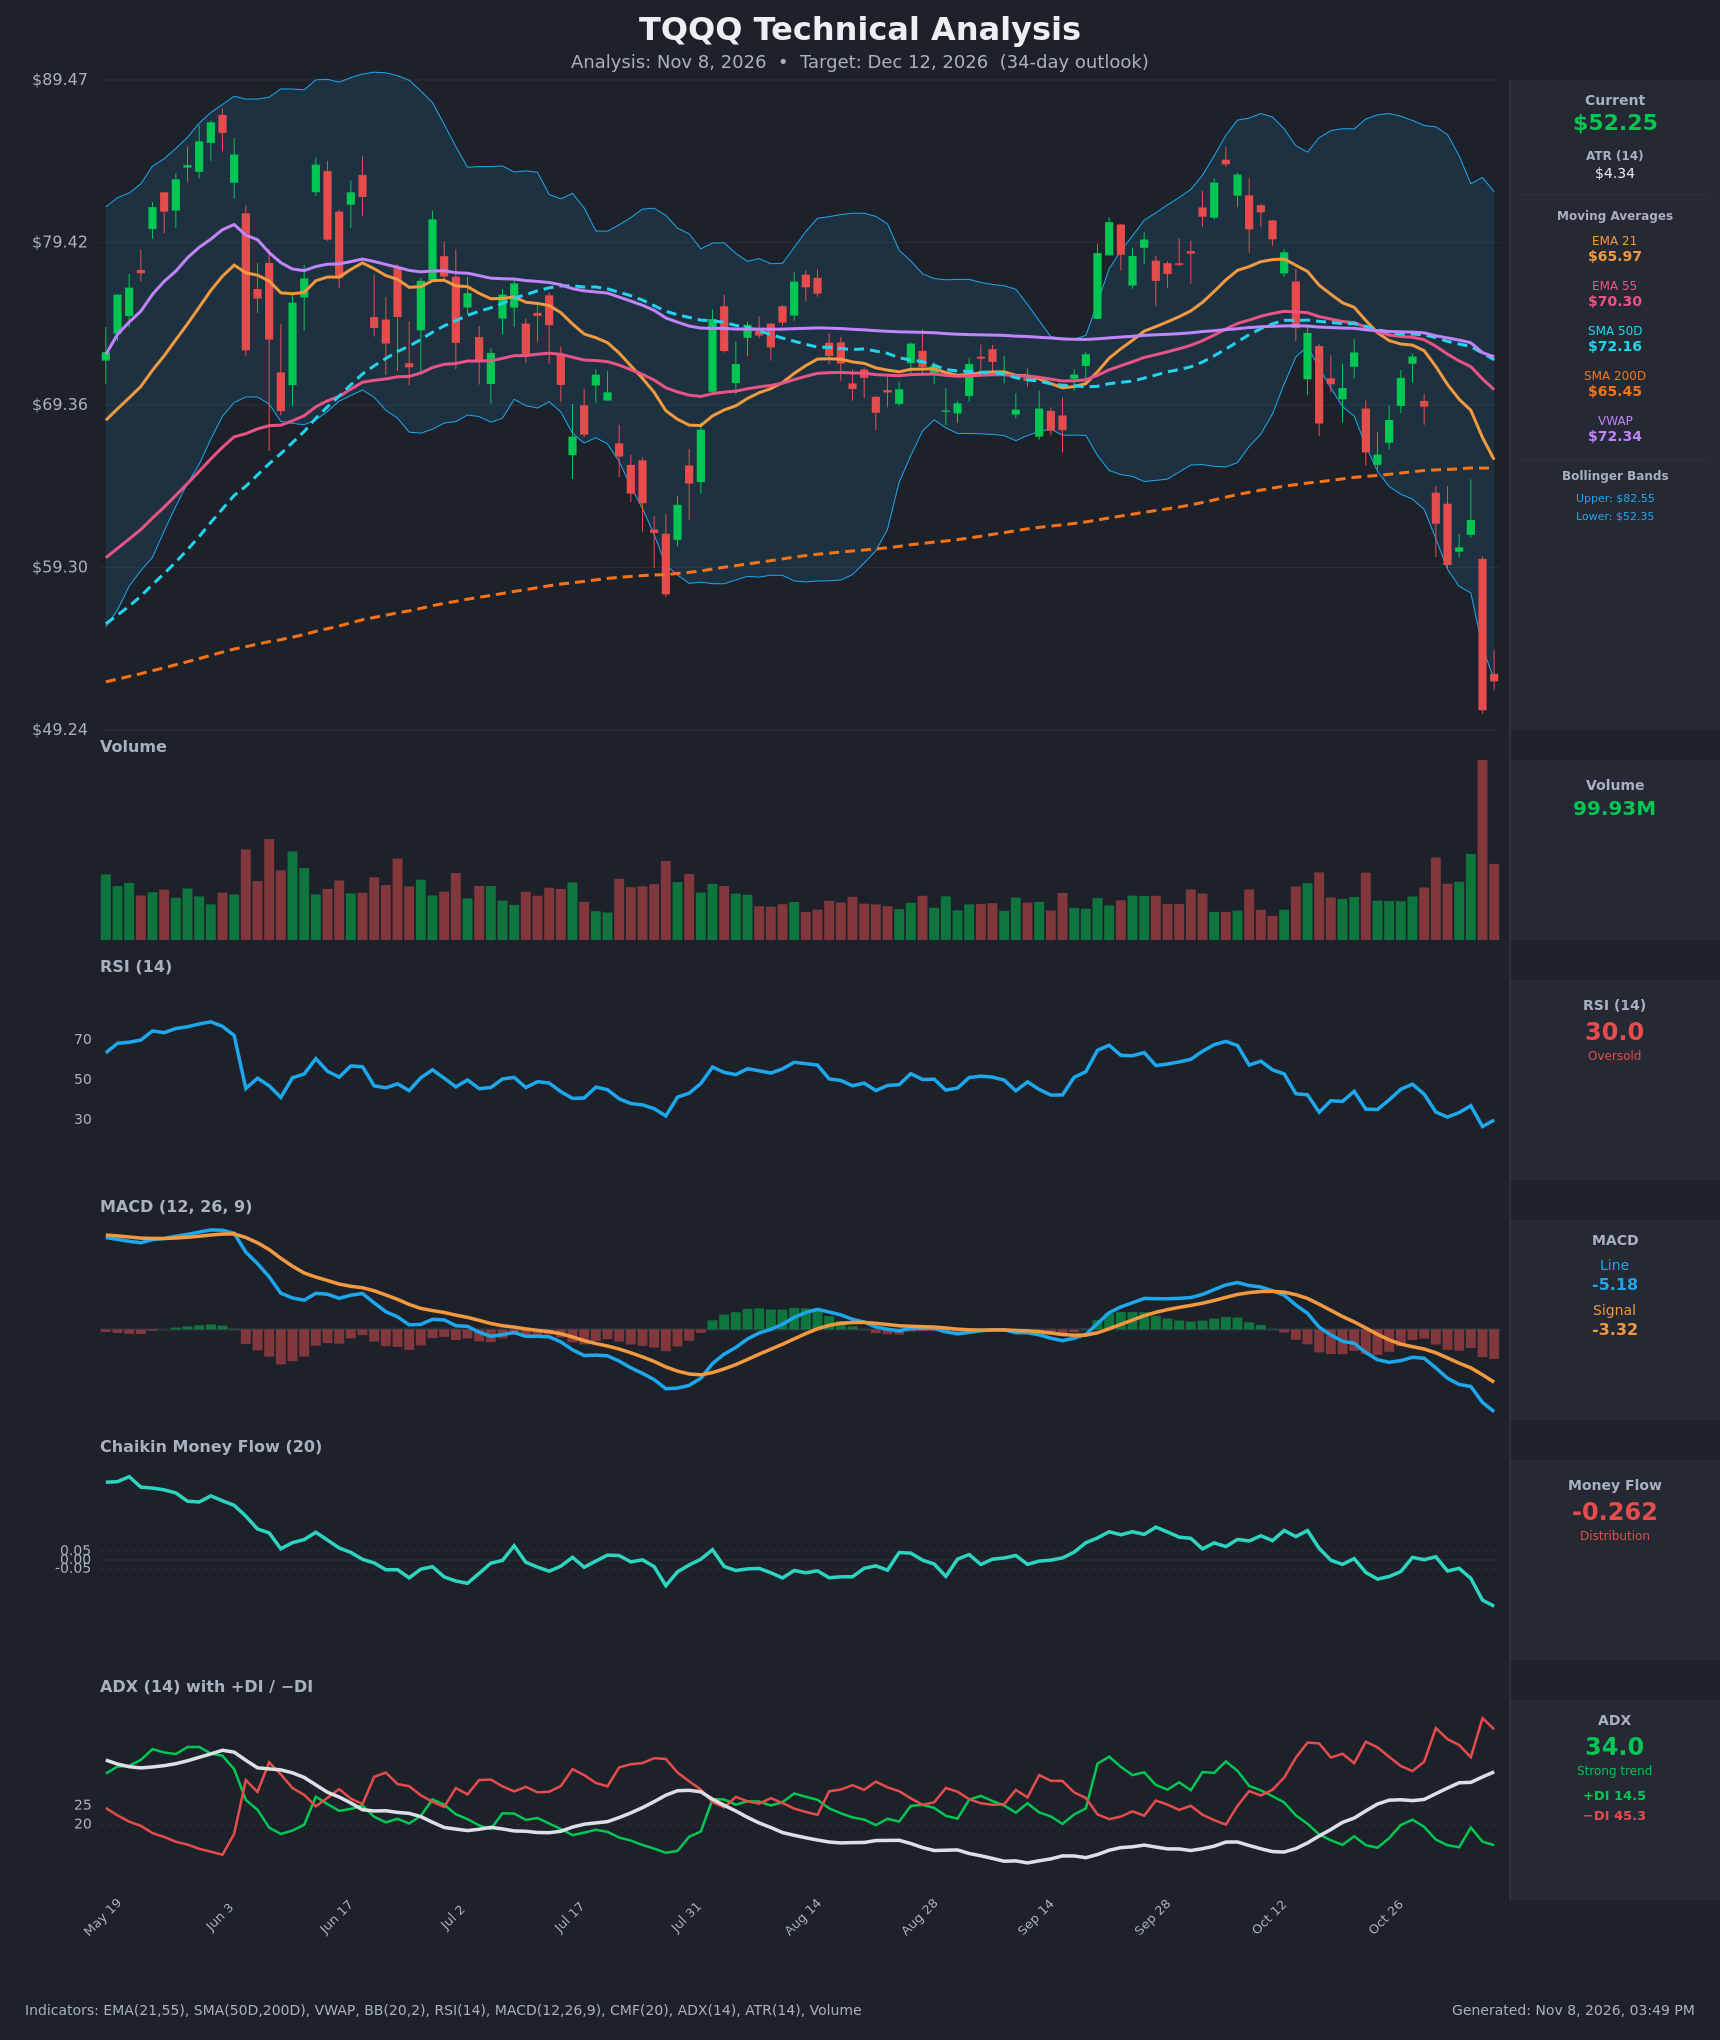
- RSI (14): 29.96, right at the oversold line after dropping from about 48 (Oct 28) to a low of 26.8 on Nov 5. Momentum is still pointing down. Oversold readings in a strong downtrend can stay oversold, though they also raise the odds of a relief bounce. [Neutral]
- 20 EMA: The chart shows EMA 21 at $65.97, and price at $52.25 is about 21% below it. The EMA is falling steeply and now acts as overhead resistance. EMA21 crossed below EMA55 ($70.30) around Oct 28–29, which is a bearish crossover. [Bearish]
- MACD: The line is -5.18, below the signal at -3.32, and the gap is widening. The histogram is negative and growing. The bearish crossover happened around Oct 22–23 and has been confirmed since, with no sign of a turn. [Bearish]
- Bollinger Bands (20): Price is at $52.25, just under the lower band ($52.35), with the upper band at $82.55. The bands are wide, which means high volatility. A close outside the lower band in a trending market usually signals trend strength, but it also marks short-term stretch. [Bearish]
- CMF (20): -0.262, deep in distribution territory. It has fallen sharply from slightly negative readings in late October and is well below the -0.05 threshold. Selling pressure is heavy and accelerating. [Distribution]
- ADX (14): 34.0 and rising, with −DI (45.3) far above +DI (14.5). This is a strong, well-established downtrend with bears firmly in control. [Strong Trend – Bearish]
- Volume: 99.93M on Nov 6 was the highest volume on the chart, on the heels of the large red candle on Nov 5. This looks like a capitulation or breakdown bar. It confirms the selling is aggressive, but it could also mark an exhaustion low that leads to a short-term bounce. [Bearish confirmation / possible capitulation]
Other trend context:
- Price vs long-term averages: Price is below the SMA200 ($65.45), the SMA50 ($72.16), VWAP ($72.34) and both EMAs. Every major average is above price.
- SMA50 vs SMA200: The SMA50 is still above the SMA200, so there is no death cross yet. The gap is narrowing, and a death cross is possible in the coming weeks if price stays depressed.
DIVERGENCES & TRENDS
- No bullish divergence yet: RSI printed a low of 26.8 on Nov 5 and has bounced to 30, while price made a new low on Nov 5–6. That is not a divergence. MACD and CMF are both making new lows with price, which confirms the downtrend.
- Indicator trends: MACD is sloping down hard, CMF has rolled over into deep distribution, and ADX has risen from about 19 to 34 as −DI has dominated. These all describe a trend that is gaining strength.
- Breaks and crossovers:
- Price broke below the SMA200 and the July swing low (~$59), which was a key support area.
- EMA21 crossed below EMA55 and MACD crossed below its signal.
- −DI crossed above +DI around Oct 22 and has stayed there.
- Price is at the lower Bollinger Band.
- Conflict: Only the oversold RSI and the climactic volume argue for a bounce. They support a short-term relief rally, but not a trend reversal.
CHART PATTERNS
- Breakdown from a range (Bearish Triple Top / Rectangle-type structure): Price oscillated between about $59 and $83 from May to October, with repeated rejections near the upper band and a failed rally attempt in October. The break below the range floor (~$59) on heavy volume is a bearish resolution. Measured-move logic projects toward the high $40s to mid $40s, since the range is deep. A near-term target is the recent low around $49.
- Bearish Pennant/Flag-like bounce: The Oct 22–28 bounce (~$66 to $72) failed at the falling EMA21/EMA55 and led into the next leg down. This is a continuation signal.
- Significance: The pattern backs the bearish bias. Rebounds toward $59–62 (the gap zone) would be selling opportunities unless price reclaims the SMA200 (~$65).
POTENTIAL SCENARIOS
- Scenario 1: Bearish Trend Continuation — The strong downtrend persists, with a weak bounce and lower highs below the falling EMA21. Trigger: Close below $49.24 (the Nov 5–6 low), with CMF staying below -0.05 and −DI staying above 40. Target: $45–$49, with an extension toward $43–$44 if volume expands. Invalidation: Daily close above $59.50 with RSI back above 45. (50% probability)
- Scenario 2: Bullish Oversold Relief Bounce — Capitulation volume and an oversold RSI at the lower band spark a short-covering rally into the gap zone, where it stalls. Trigger: A hold above $49.24 and a close above about $56. Target: $58–$60, with a stretch toward the $62 gap fill. Invalidation: A close below $49.24. (35% probability)
- Scenario 3: Neutral Basing Range — Price chops between $48 and $57 as selling exhausts and buyers wait for confirmation. Trigger: ADX rolls over from 34 and price holds $49–$57 for weeks. Target: $50–$55. Invalidation: A break outside $48–$57. (15% probability)
PRICE TARGETS
For a 34-day horizon, the expected range width should be roughly 12–18% of the current price. The range here is $9.00 wide, about 17.2% of $52.25, which fits.
- Target Price: $49.00 (34-day)
- Expected Range: $45.00 to $54.00
- Key Levels: Support at $49.24, Resistance at $59.46
OVERALL BIAS
OVERALL BIAS: BEARISH - A strong, accelerating downtrend (ADX 34, −DI 45 vs +DI 15) with a bearish MACD, deep CMF distribution, and a heavy-volume breakdown below the SMA200 and the multi-month range. The oversold RSI makes a relief bounce likely along the way, but the evidence favors lower prices by the 34-day mark, and conviction is modest.
This is educational analysis and not financial advice.