QCOM 55-day bearish forecast — Nov 8, 2026
- Bias: Bearish
- Timeframe: 55 days (made Nov 8, 2026, target date Jan 1, 2027)
- Price at analysis: $165.41
- Price target: $159.00
- Expected range: $148.00 – $174.00
- Result: Pending — graded after the close on Jan 1, 2027
Get a free AI analysis of QCOM today
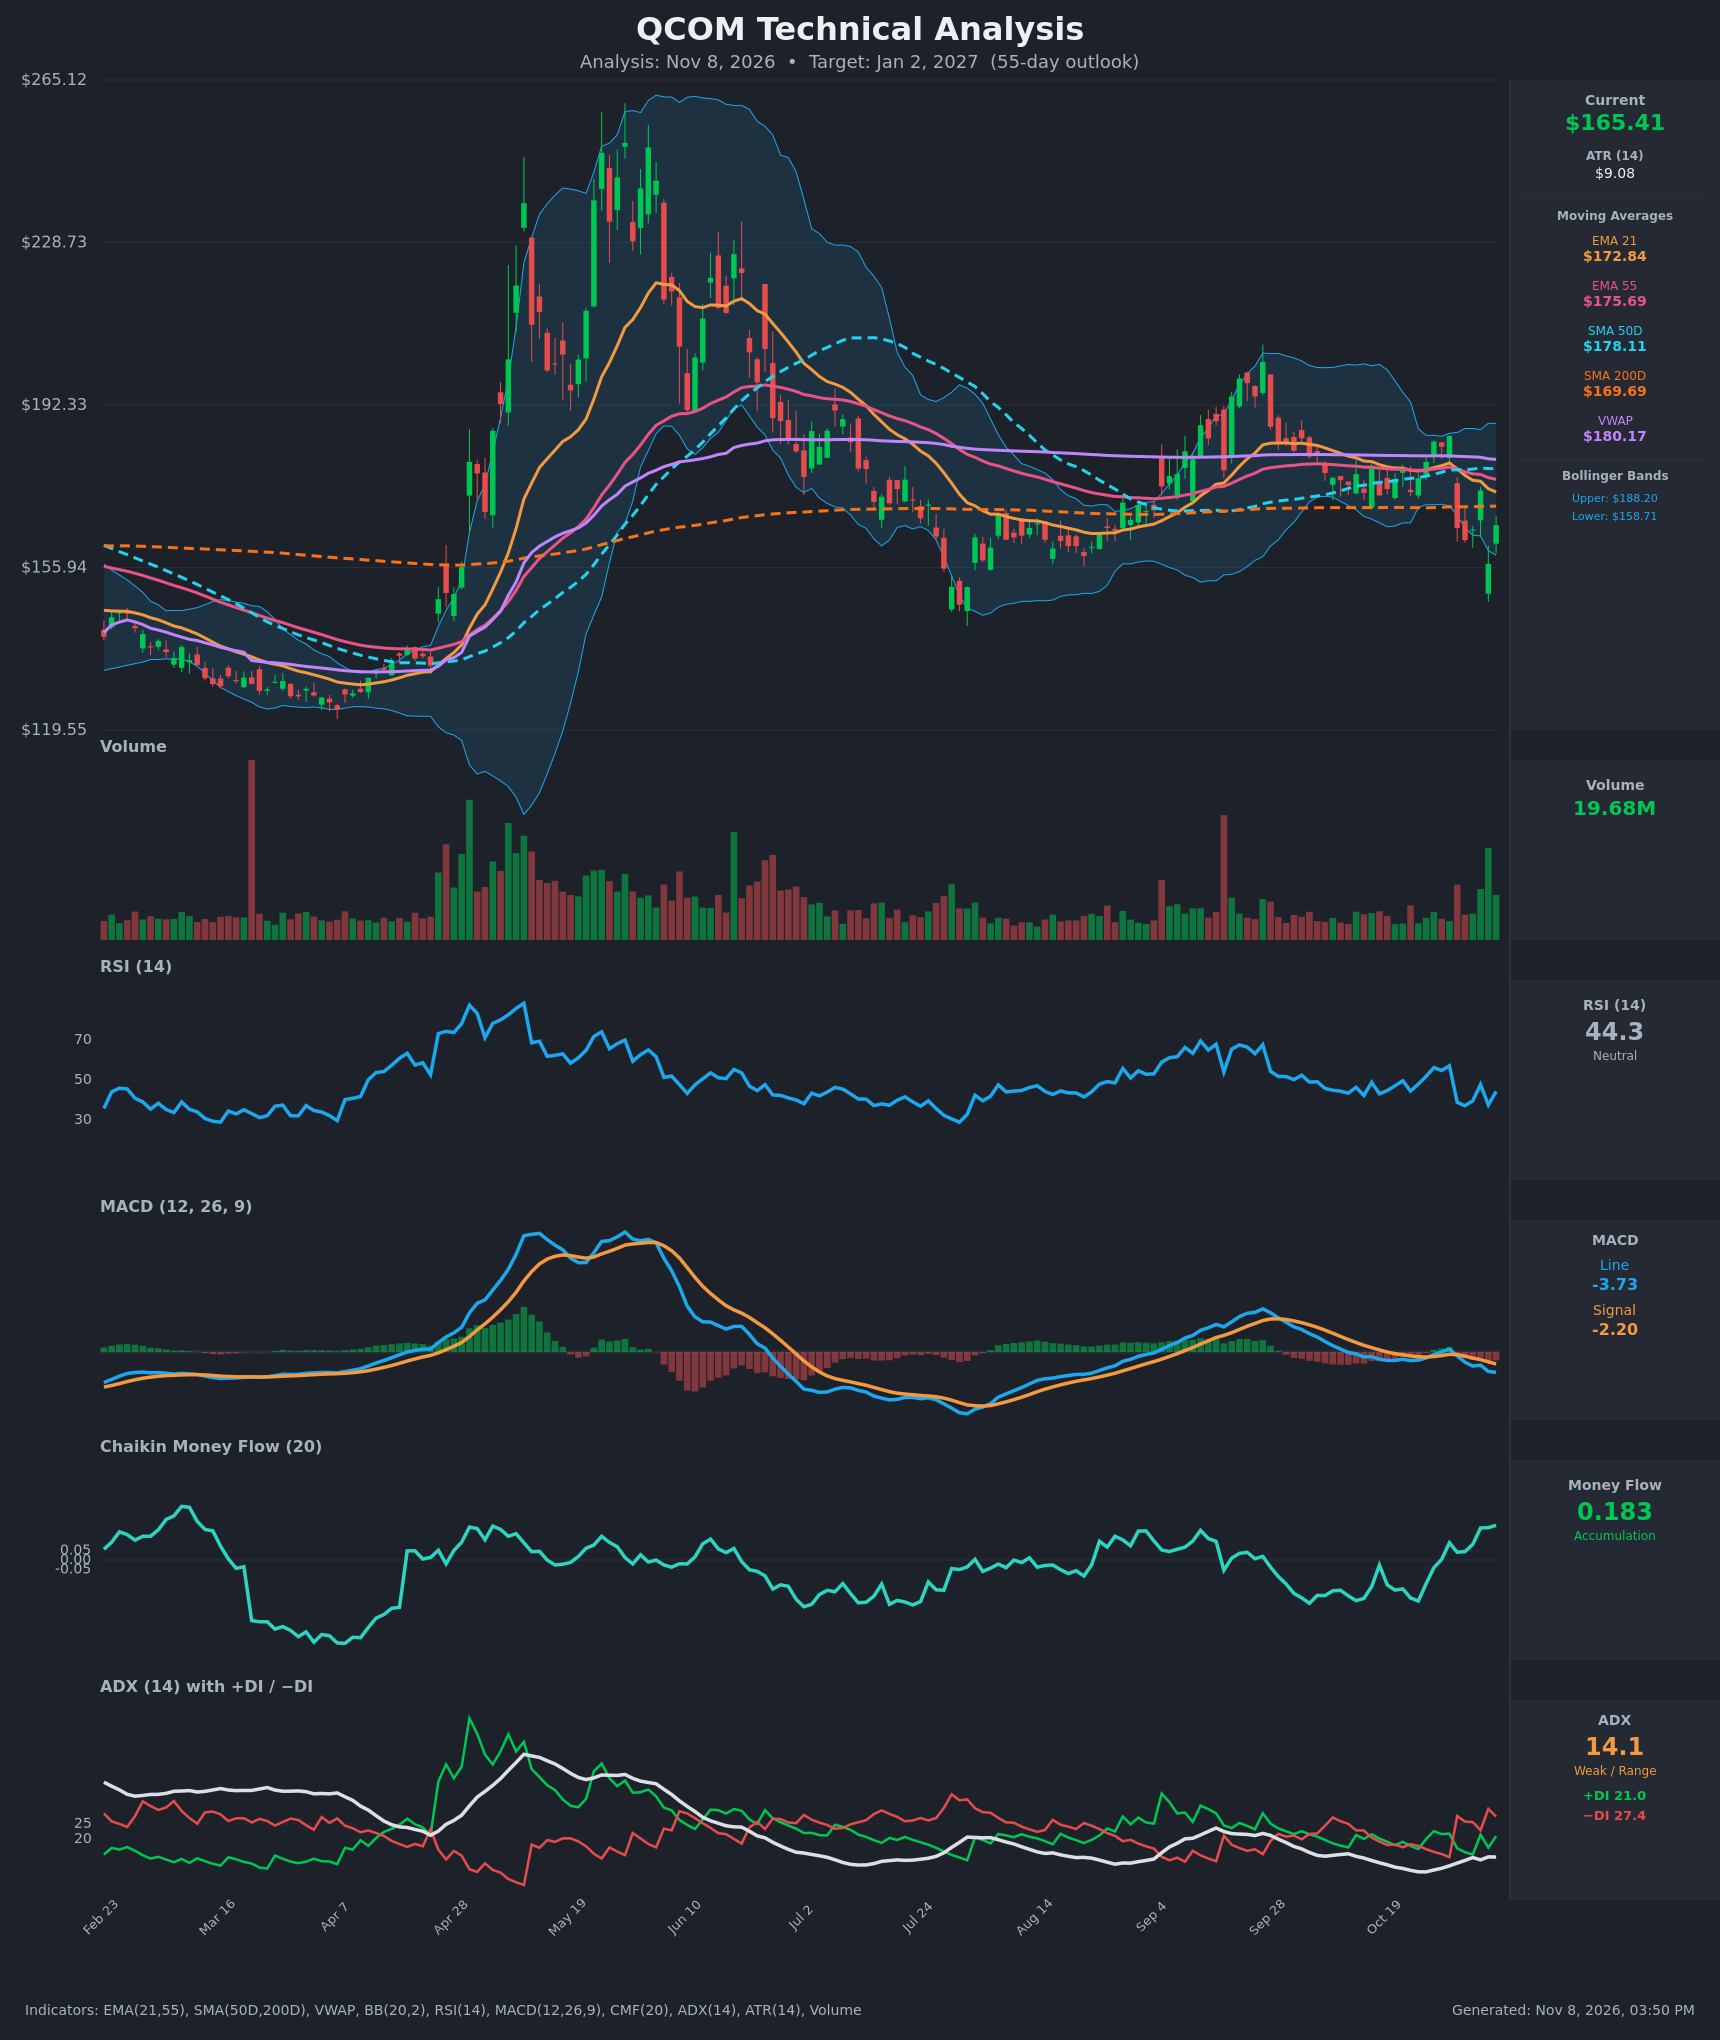
Analysis
TECHNICAL INDICATORS
- RSI (14): 44.29, in the neutral zone and well off the 57 peak on Oct 29. It has whipsawed between 37 and 48 since the Oct 30 gap down, so there is no oversold reading and no momentum recovery yet. [Neutral]
- 20 EMA (EMA 21): $172.84, with price about 4.3% below it. The EMA is falling quickly (from $179.35 on Oct 29) and is also below EMA 55 ($175.69), a fresh bearish EMA cross. It now acts as overhead resistance. [Bearish]
- MACD: Line -3.73 is below signal -2.20, and the gap is widening. The line crossed below zero on Oct 30, and the histogram is negative and expanding. Momentum is clearly down. [Bearish]
- Bollinger Bands (20): Price at $165.41 sits in the lower half of the bands ($158.71 lower, $188.20 upper). It tagged the lower band area on Nov 5 ($156.75 close) and bounced. The bands are wide, which reflects the recent volatility spikes. The lower band is near-term support, and the midline (around $173) is resistance. [Neutral]
- CMF (20): +0.183, well above +0.05 and rising from about -0.2 in late October. Money flow is improving even as price made lower lows, a mild positive divergence. [Accumulation]
- ADX (14): 14.1 (weak, range-bound), with −DI (27.4) above +DI (21.0). Sellers lead, but trend strength is weak, so a sustained directional move is not confirmed. [Weak Trend, Bearish lean]
- Volume: 19.68M, elevated versus the typical 8-12M. Volume spiked on the Oct 30 and Nov 5 selloffs, which points to event-driven distribution. The latest green bar on decent volume shows some dip-buying. [Mixed, selling pressure on breaks with a modest bounce]
DIVERGENCES & TRENDS
- Price vs CMF: Price made a lower low ($156.75 vs $162.08) while CMF rose to +0.183. This is a bullish divergence and the main counterweight to the bearish case.
- Moving averages: Price is below EMA21, EMA55, SMA50D ($178.11), VWAP ($180.17) and SMA200D ($169.69). A close back above the SMA200 is the first test of a recovery. SMA50 remains above SMA200, so there is no death cross yet. A narrowing gap ($178.11 vs $169.69) is worth watching.
- MACD: The bearish crossover on Oct 30 has since widened. The MACD line is making new lows for the move, which confirms the downward momentum.
- DI: −DI crossed above +DI on Oct 30 and has stayed there. ADX is only 14, so this is a bearish tilt inside a choppy structure.
- Volatility: Two large gap-down days (about -11% on Oct 30 and -9.5% on Nov 5) show sellers hit hard on bad news. Rebounds have been sharp but short-lived.
CHART PATTERNS
- Broad range with lower highs: Since June, price has moved sideways to lower between about $145 and $205. The most recent rally failed near $185-$188 (the upper Bollinger Band) and rolled over. This is closest to a Bearish Triple Top / range structure from the diagram rather than a clean pattern.
- Failed breakout: The Oct 29 push to $185 reversed immediately. The failed move above the SMA50 and VWAP cluster is a bearish rejection.
- Support: The $145-$157 zone, from the July lows and the Nov 5 low, is the floor of the range. A break below it would target the low $140s and then about $135. Holding it keeps a bounce toward $172-$178 possible.
POTENTIAL SCENARIOS
- Scenario 1: Bearish Lower-High Rollover and Range Retest — Price stays capped under the falling EMA21/EMA55 and the SMA200, and sellers (−DI, negative MACD) push it back to the range floor. Trigger: rejection at $169.70-$173 and a close below $156.75. Target: $148-$155, with an extension to about $145 on a breakdown. Invalidation: a daily close above $178 (SMA50). (45% probability)
- Scenario 2: Bullish Mean-Reversion Recovery — CMF accumulation and the lower-band bounce lead to a recovery rally into the moving-average cluster. Trigger: reclaim of the SMA200 ($169.69) and EMA21 ($172.84) with MACD histogram turning up. Target: $175-$180 (EMA55 / SMA50), with an upper stretch to about $185. Invalidation: a close below $156 that negates the bounce. (35% probability)
- Scenario 3: Neutral Choppy Consolidation — Weak ADX keeps price between about $156 and $172 as the post-earnings volatility fades. Trigger: repeated failures at the SMA200/EMA21 and holds above $156. Target: $160-$170. Invalidation: a close outside the $155-$175 range. (20% probability)
PRICE TARGETS
- Target Price: $159.00 (55-day horizon, about 3.9% below current)
- Expected Range: $148.00 to $174.00 (width $26.00, about 15.7% of current price, consistent with the 30-60 day guidance of 12-18%)
- Key Levels: Support at $156.75, Resistance at $169.69
OVERALL BIAS
OVERALL BIAS: BEARISH - Price sits below every major moving average, including the SMA200, with a widening bearish MACD and −DI above +DI. Recent rallies have failed under the falling EMA21/EMA55 cluster. The positive CMF divergence and weak ADX keep conviction modest, so a bounce toward $172-$178 is the main risk to this view.
This is educational analysis and not financial advice.