QQQ 55-day bearish forecast — Nov 8, 2026
- Bias: Bearish
- Timeframe: 55 days (made Nov 8, 2026, target date Jan 1, 2027)
- Price at analysis: $656.10
- Price target: $638.00
- Expected range: $585.00 – $685.00
- Result: Pending — graded after the close on Jan 1, 2027
Get a free AI analysis of QQQ today
Analysis
TECHNICAL INDICATORS
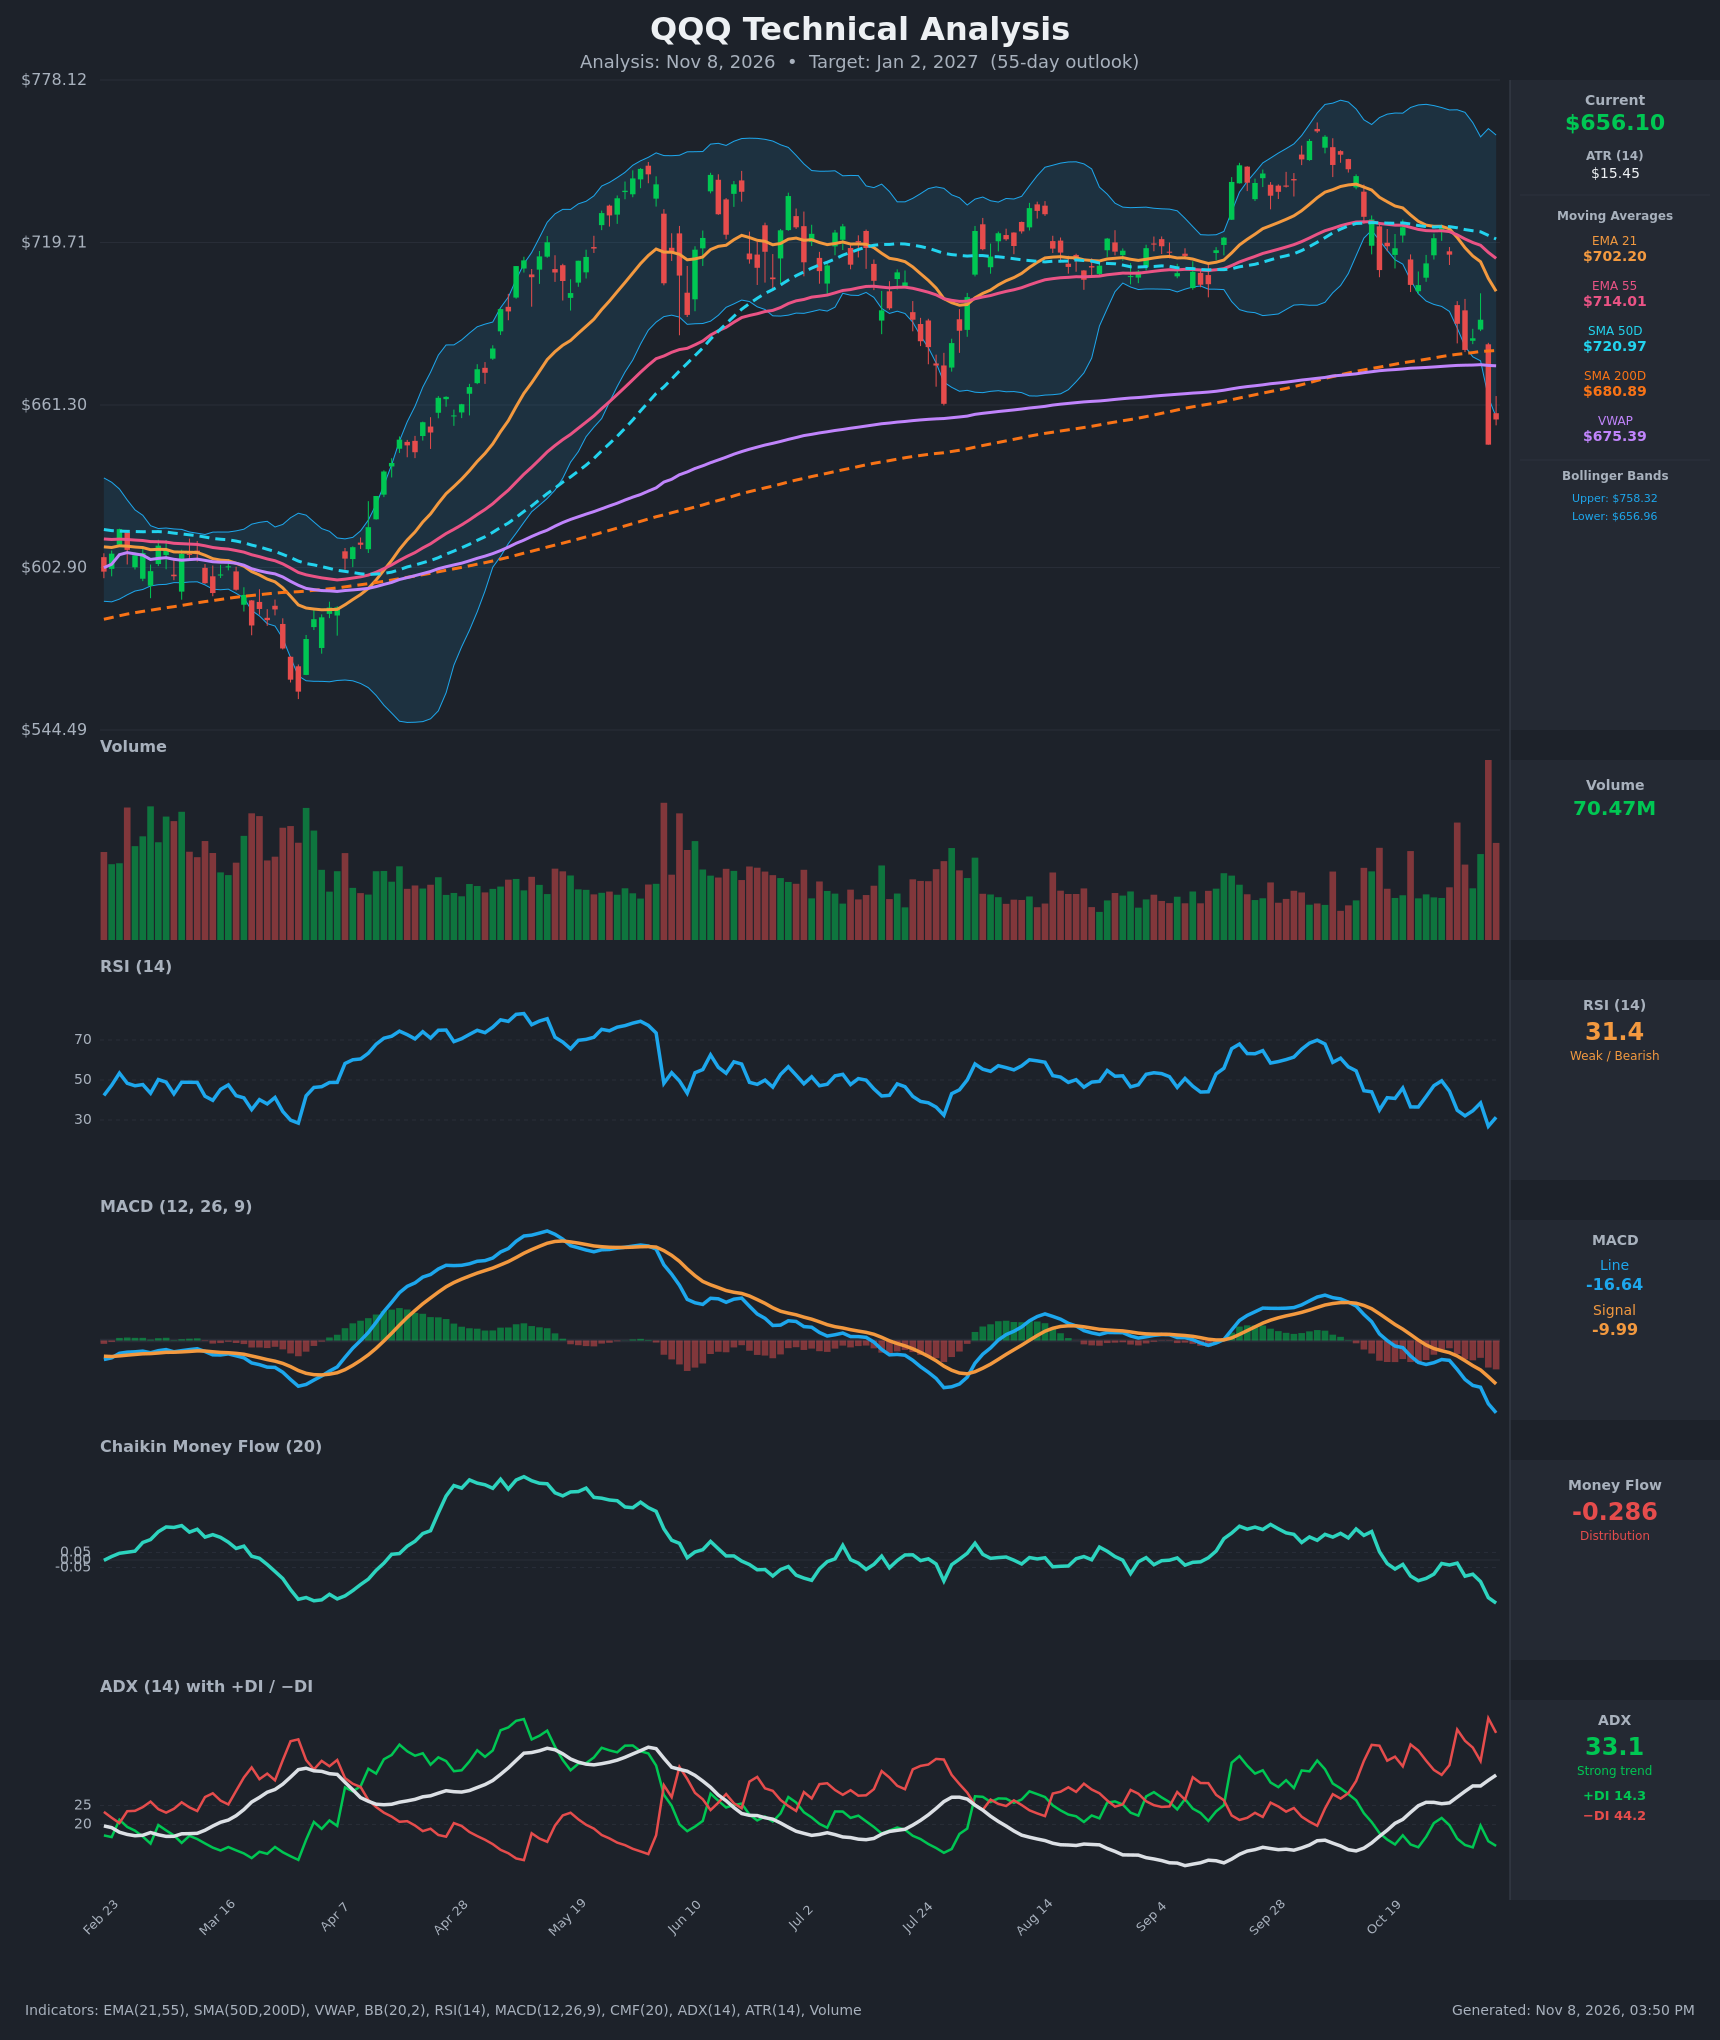
- RSI (14): 31.37, just above oversold. It was 26.9 on Nov 5 and bounced slightly. It has been making lower highs since the Oct 28 reading of 49.6, so momentum is firmly bearish even though a short-term bounce is possible. [Bearish]
- 20 EMA (EMA 21): $702.20, with price at $656.10 about 6.6% below it. EMA 21 has crossed below EMA 55 ($714.01) and is sloping down, so it now acts as overhead resistance. [Bearish]
- MACD: Line -16.64 is below Signal -9.99. The bearish crossover happened around Oct 26, and the gap has widened to about -6.6, with the histogram increasingly negative. Momentum is accelerating down, with no sign of a bottom. [Bearish]
- Bollinger Bands (20): Price is at $656.10, right at the lower band ($656.96) and far below the mid-band. The bands are expanding after the Nov 5 gap-down. This is a band-walk or volatility expansion to the downside, and it also flags short-term stretched conditions where a relief bounce is likely. [Bearish]
- CMF (20): -0.286, well below the -0.05 threshold and at the weakest level on the chart. It has fallen steadily from positive readings in September, which points to heavy, persistent distribution. [Distribution]
- ADX (14): 33.1 and rising from below 20 on Oct 19. −DI (44.2) is far above +DI (14.3). This is a strong, established downtrend with sellers in clear control. [Strong Trend - Bearish]
- Volume: 70.47M, the highest volume on the chart, on a large gap-down candle (Nov 5, -6.5%). It confirms the breakdown is backed by real selling. It could also mark capitulation, but there is no confirming reversal yet. [Bearish - heavy-volume breakdown]
DIVERGENCES & TRENDS
- No bullish divergence yet: RSI (31.4) sits above its Nov 5 low (26.9), but price has not made a higher low, so this is not a valid divergence. MACD and CMF are both making new lows alongside price, which confirms the move.
- Moving average structure: EMA 21 has crossed below EMA 55 (confirmed in the last few bars). SMA50D ($720.97) is still above SMA200D ($680.89), so there is no death cross yet. However, SMA50D is rolling over and the gap is narrowing.
- SMA200D break: Price closed below the 200-day SMA ($680.89) on Nov 5 and failed to reclaim it on the Nov 6 bounce. VWAP ($675.39) is also now overhead. This is a loss of long-term trend support.
- DI and ADX: −DI has led +DI since Oct 19 and the spread is widening, while ADX is rising through 25, which confirms trend strength.
- MACD: The bearish crossover is intact and the histogram is widening, with no stabilization.
- Oversold condition: RSI near 30 and price at the lower Bollinger Band make a dead-cat bounce toward $680-$700 likely. Rallies into the EMA/SMA cluster are likely to be sold unless they reclaim $681 and hold.
CHART PATTERNS
- Bearish topping structure (Double Top / Head and Shoulders-style): Price made lower-timeframe highs near $735 (May) and about $755-$760 (Sep/Oct). It then rolled over into a $700-$725 consolidation and has now broken the lower support zone (~$680-$690 and the SMA200D). This resembles a bearish Head and Shoulders / Double Top breakdown.
- Measured move: The structure runs from about $758 down to a neckline near $680, roughly $78. Projecting that below the neckline gives a theoretical target near $600-$605, which also lines up with the chart's $602.90 horizontal level. A full measured move within 55 days is the bearish tail case, not the base case.
- Retest risk: A bounce back to the broken $680-$690 zone (neckline, SMA200D, VWAP) would be a classic breakdown retest and a resistance test.
- Bullish alternative: A fast reclaim of $690+ would turn the gap-down into a failed breakdown or bear trap. That is not the current evidence.
POTENTIAL SCENARIOS
- Scenario 1: Bearish Breakdown Continuation — Price bounces toward the $675-$690 zone (SMA200D/VWAP retest), gets rejected, and then resumes lower, driven by strong −DI, negative MACD and distribution flows. Trigger: rejection at $680-$690 or a daily close below $640 (Nov 5 low zone). Target: $600-$640, with the low end near the $602.90 level. Invalidation: daily close above $705 (EMA 21), which would negate the breakdown. (50% probability)
- Scenario 2: Bullish Oversold Reversal — Capitulation-type volume and an oversold RSI spark a sharp mean reversion that reclaims the SMA200D and VWAP and rallies back to the EMA cluster. Trigger: daily close above $681 with RSI back above 45 and MACD histogram shrinking. Target: $700-$715 (EMA 21 / EMA 55). Invalidation: failure to hold $681 and a break below $640. (30% probability)
- Scenario 3: Neutral Choppy Base — After the sharp drop, price bounces and chops between about $640 and $685 as the trend exhaustion resolves sideways. Trigger: ADX peaking and rolling over, and RSI holding in the 35-50 range. Target: $645-$680 range. Invalidation: a close beyond either edge of the range ($635 on the downside or $690 on the upside). (20% probability)
PRICE TARGETS
- Target Price: $638.00 (55 days out, about Jan 2, 2027)
- Expected Range: $585.00 to $685.00 (width $100, about 15.2% of the current price, consistent with the 30-60 day guidance of 12-18%)
- Key Levels: Support at $640.00 (Nov 5 low area), Resistance at $680.89 (SMA200D)
OVERALL BIAS
OVERALL BIAS: BEARISH - Price has broken below the SMA200D and all the EMAs on record volume. MACD is deeply negative, CMF shows heavy distribution (-0.286), and ADX (33.1) with −DI dominant confirms a strong downtrend. An oversold bounce is likely, but rallies toward $680-$700 should meet resistance, favoring a lower price in 55 days.
This is educational analysis and not financial advice.