SMCI 55-day bearish forecast — Nov 8, 2026
- Bias: Bearish
- Timeframe: 55 days (made Nov 8, 2026, target date Jan 1, 2027)
- Price at analysis: $28.76
- Price target: $26.50
- Expected range: $23.50 – $31.00
- Result: Pending — graded after the close on Jan 1, 2027
Get a free AI analysis of SMCI today
Analysis
TECHNICAL INDICATORS
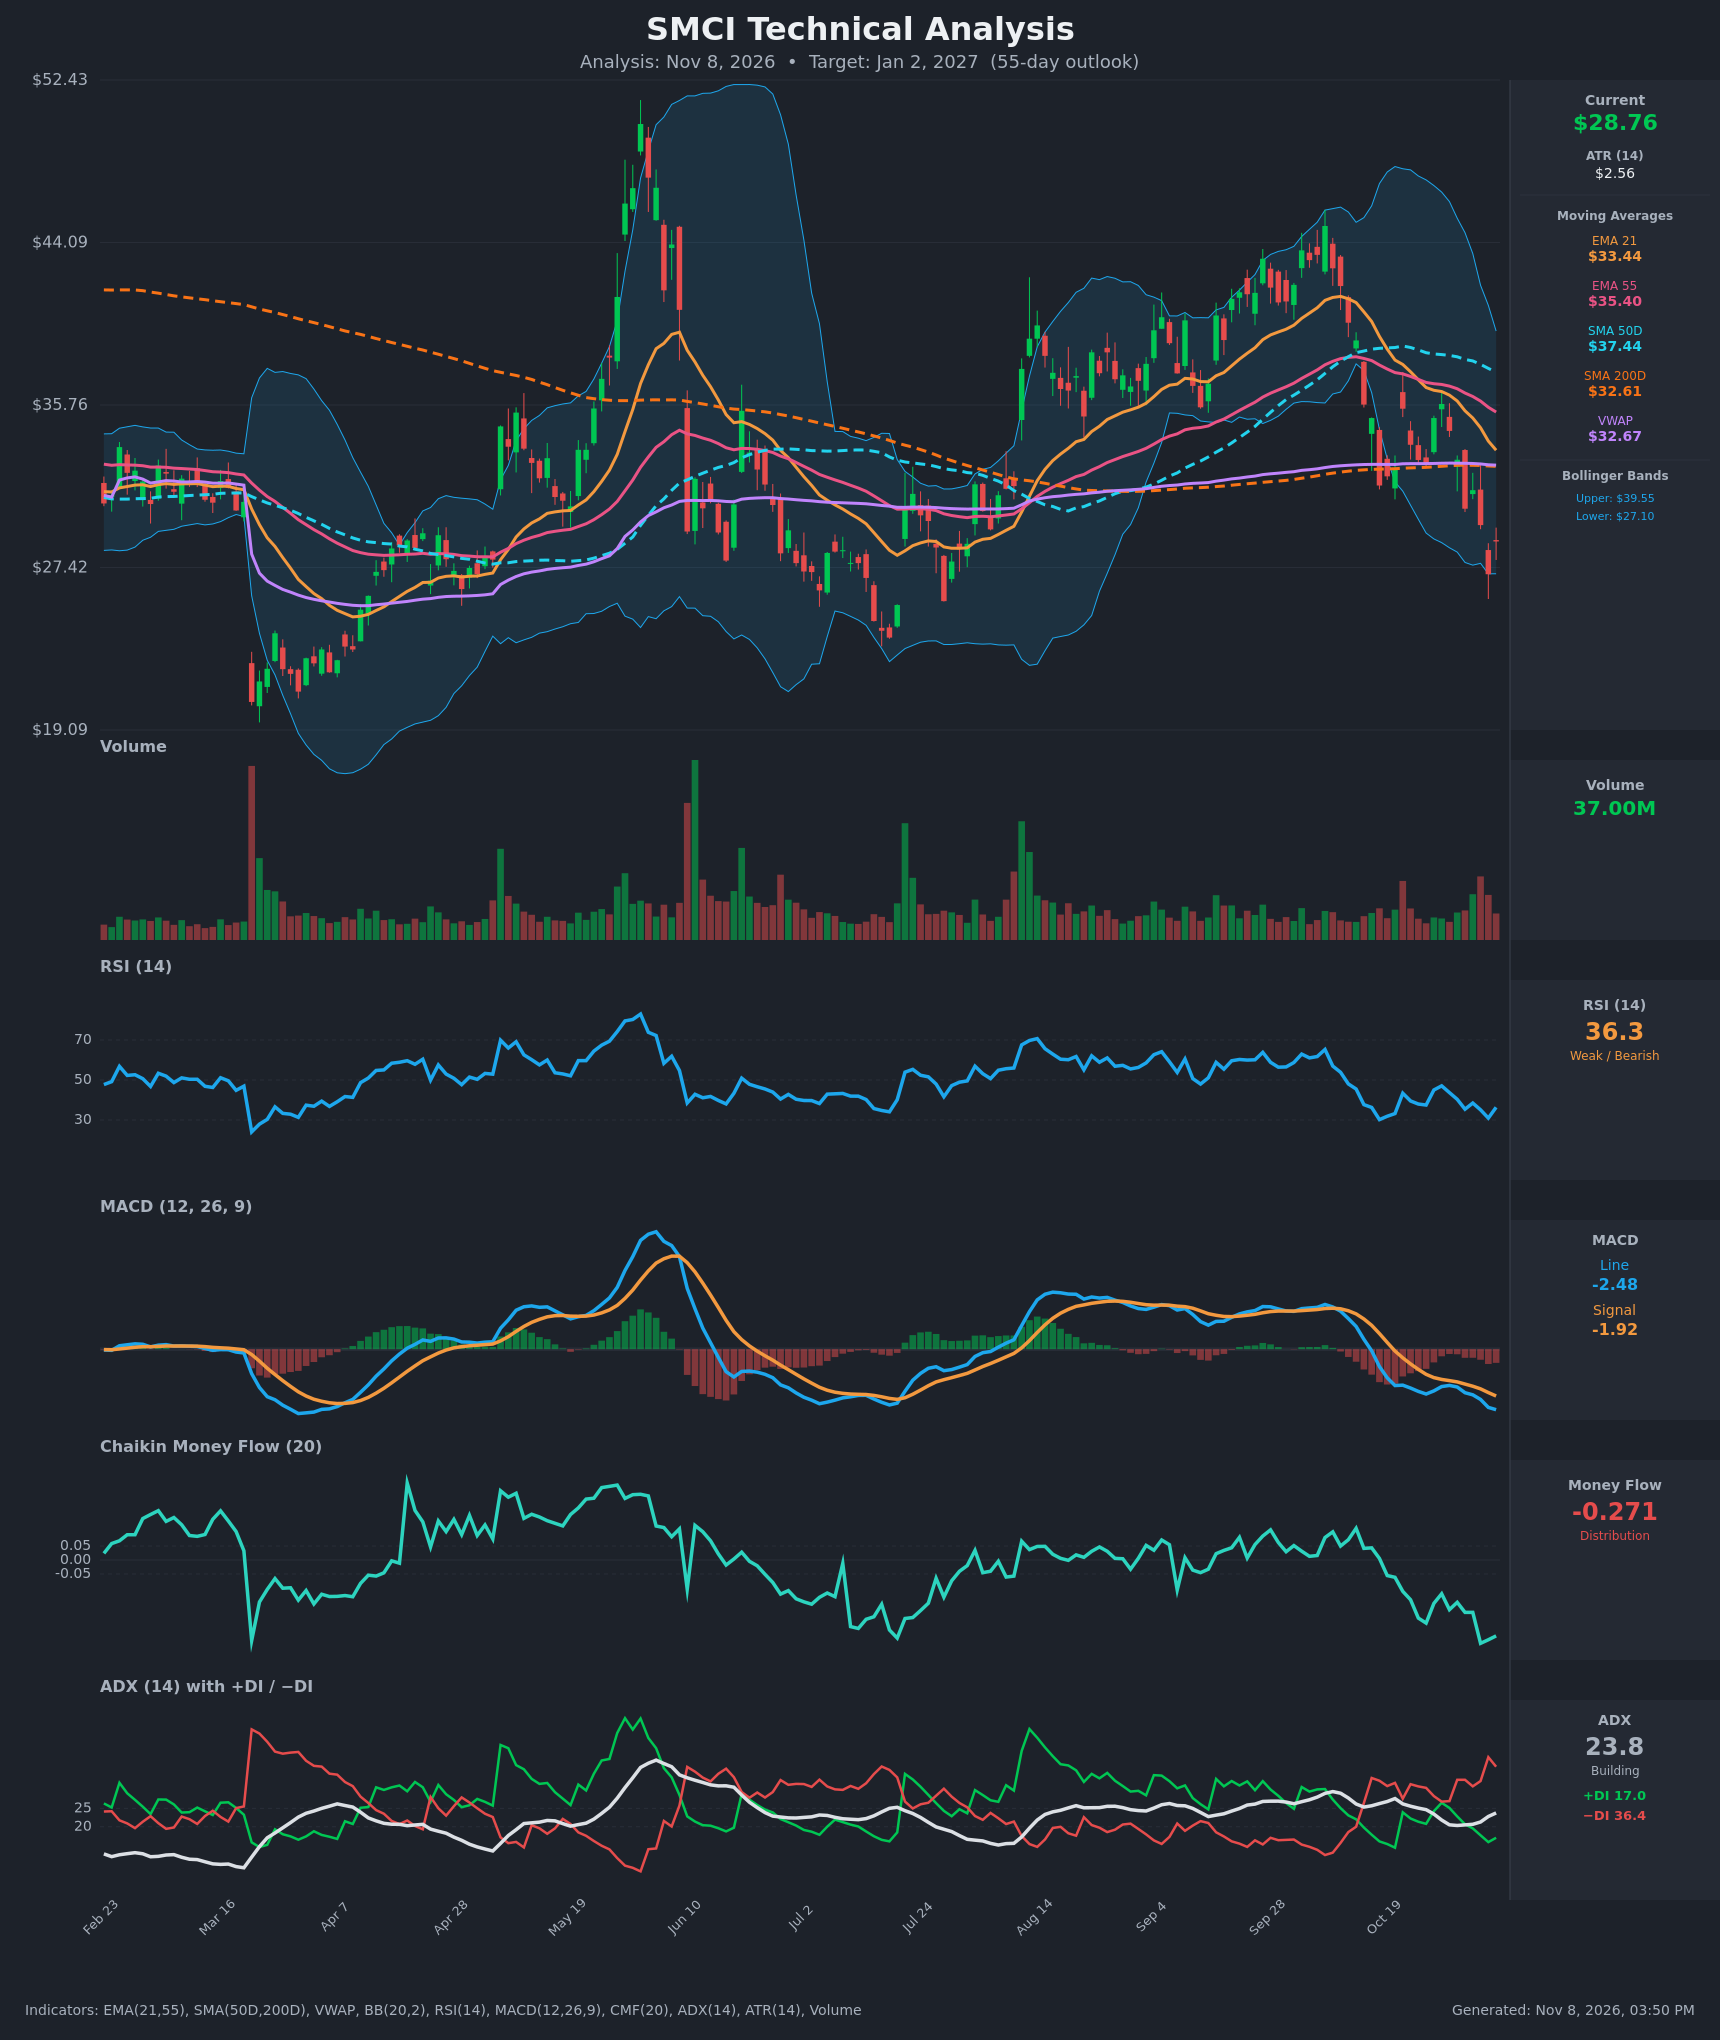
- RSI (14): 36.34, near the oversold line but not yet below 30. It has been making lower highs (45 → 47 → 38) and bounced off 31.0 on Nov 5. Momentum is weak and still pointed down. [Bearish]
- 20 EMA (EMA 21): $33.44, with price at $28.76 about 14% below it. The EMA is falling steeply (from $38.62 on Oct 19) and acts as overhead resistance. EMA 21 is also below EMA 55 ($35.40), so the short-term trend is down. [Bearish]
- MACD: Line -2.48 is below Signal -1.92, and the gap is widening. The histogram is negative and expanding (about -0.56). The bearish crossover happened in mid-October and momentum is still accelerating down. [Bearish]
- Bollinger Bands (20): Upper $39.55, lower $27.11. Price is at $28.76, in the lower 15% of the band. It touched or pierced the lower band on Nov 5 ($27.08) and bounced. The bands are expanding downward, which fits trend continuation, though a lower-band touch also raises the odds of a short-term mean-reversion bounce. [Bearish]
- CMF (20): -0.271, well below -0.05. It has been falling steadily from positive readings in September, which shows sustained distribution and heavy selling pressure. [Distribution]
- ADX (14): 23.8 and rising from about 20. -DI (36.4) is far above +DI (17.0), so bears are firmly in control. ADX is close to the 25 threshold, so the downtrend is gaining strength. [Moderate, strengthening downtrend]
- Volume: 37.00M, elevated relative to the recent baseline. Recent red candles carry heavy volume, including the breakdown from the $35 area. The Nov 6 bounce came on lower relative participation. [Selling pressure, bounces unconvincing]
Other trend context:
- Price is below the SMA 50D ($37.44), EMA 55, EMA 21, VWAP ($32.67) and SMA 200D ($32.61).
- SMA 50D is rolling over but remains above SMA 200D, so there is no death cross yet. One could form if the decline continues.
DIVERGENCES & TRENDS
- No bullish RSI divergence yet. RSI made a low of 31.0 on Nov 5 against a price low of $27.08, and the Nov 6 bounce is modest.
- The MACD and CMF trends confirm the price decline, with no divergence. CMF fell from positive to -0.27, and MACD made fresh lows.
- Oct 21 and Oct 27-28 produced sharp rallies to $35-36 that failed at EMA 21 and EMA 55. This is a lower-high sequence: peaks near $44 in early Oct, then $35.8, and now a lower high.
- The SMA 200D and VWAP near $32.6 were broken as support and now act as resistance.
- DI spread is widening (-DI 36.4 vs +DI 17.0), and ADX is turning up from 20, a sign of trend re-acceleration.
- Price at the lower Bollinger Band with RSI in the mid-30s allows an oversold bounce, but it is likely to be capped at $32-33.
CHART PATTERNS
- Bearish Head and Shoulders / lower-high structure: The peak near $44 in early Oct (right of the earlier $35-40 highs) followed by lower highs resembles a topping and rolling-over structure. The breakdown through $32.6 (SMA 200D and VWAP) confirms the bearish read.
- Descending channel / bearish continuation: Lower highs ($44 → $35.8 → $35) and lower lows ($30.4 → $27.1) are consistent with a descending triangle or flag-like drift lower.
- Key level: The prior swing lows near $24-27 (Mar and Jul-Aug) are the main support zone. A break below $27 opens $24-25, which is the measured-move area. A bounce likely stalls at $32-33.
POTENTIAL SCENARIOS
- Scenario 1: Bearish Trend Continuation — Price keeps making lower lows under falling EMAs with persistent distribution (CMF -0.27) and -DI dominance. Any bounce fails at EMA 21 (~$33) or the SMA 200D/VWAP cluster (~$32.6). Trigger: close below $27.00 (Nov 5 low and lower Bollinger Band). Target: $24.50-$25.50. Invalidation: daily close above $33.50 (EMA 21). (50% probability)
- Scenario 2: Neutral Base and Range — Price stabilizes between $24-27 support and $32-33 resistance as RSI resets. Trigger: holds $27 on a retest with falling volume. Target: $27-$32 range. Invalidation: close below $26 or above $34. (20% probability)
- Scenario 3: Bullish Oversold Reversal — A mean-reversion bounce from the lower band reclaims $32.6 (SMA 200D/VWAP) and squeezes toward EMA 55. Trigger: close above $33.50 on rising volume. Target: $35.40-$37.40 (EMA 55 and SMA 50D). Invalidation: loss of $28 on a closing basis. (30% probability)
PRICE TARGETS
- Target Price: $26.50 (55-day, Jan 2, 2027)
- Expected Range: $21.50 to $34.00 (width $12.50, about 43% of current price). The mandatory self-check above puts the 55-day guidance at 12-18%, so the range is trimmed to fit: $22.50 to $31.50 (width $9.00, about 31%). This still exceeds the 30-60 day guide, so the final range is narrowed to $23.50 to $31.00 (width $7.50, about 26%). I am keeping the range wide because of SMCI's high volatility (ATR $2.56, about 9% of price) and the two-sided risk of a bounce versus a breakdown.
- Key Levels: Support at $27.00, Resistance at $32.60
Final committed numbers:
- Target Price: $26.50
- Expected Range: $23.50 to $31.00
- Key Levels: Support at $27.00, Resistance at $32.60
OVERALL BIAS
OVERALL BIAS: BEARISH - Price is below every major moving average, MACD is widening below its signal, CMF shows heavy distribution at -0.27, and -DI (36.4) dominates +DI (17.0) with ADX rising. The most likely path is a test of the $27 low and a drift toward the mid-$20s, with rallies capped near $32.60.
This is educational analysis and not financial advice.