SPCX 55-day bearish forecast — Nov 8, 2026
- Bias: Bearish
- Timeframe: 55 days (made Nov 8, 2026, target date Jan 1, 2027)
- Price at analysis: $134.27
- Price target: $124.50
- Expected range: $113.00 – $135.00
- Result: Pending — graded after the close on Jan 1, 2027
Get a free AI analysis of SPCX today
Analysis
TECHNICAL INDICATORS
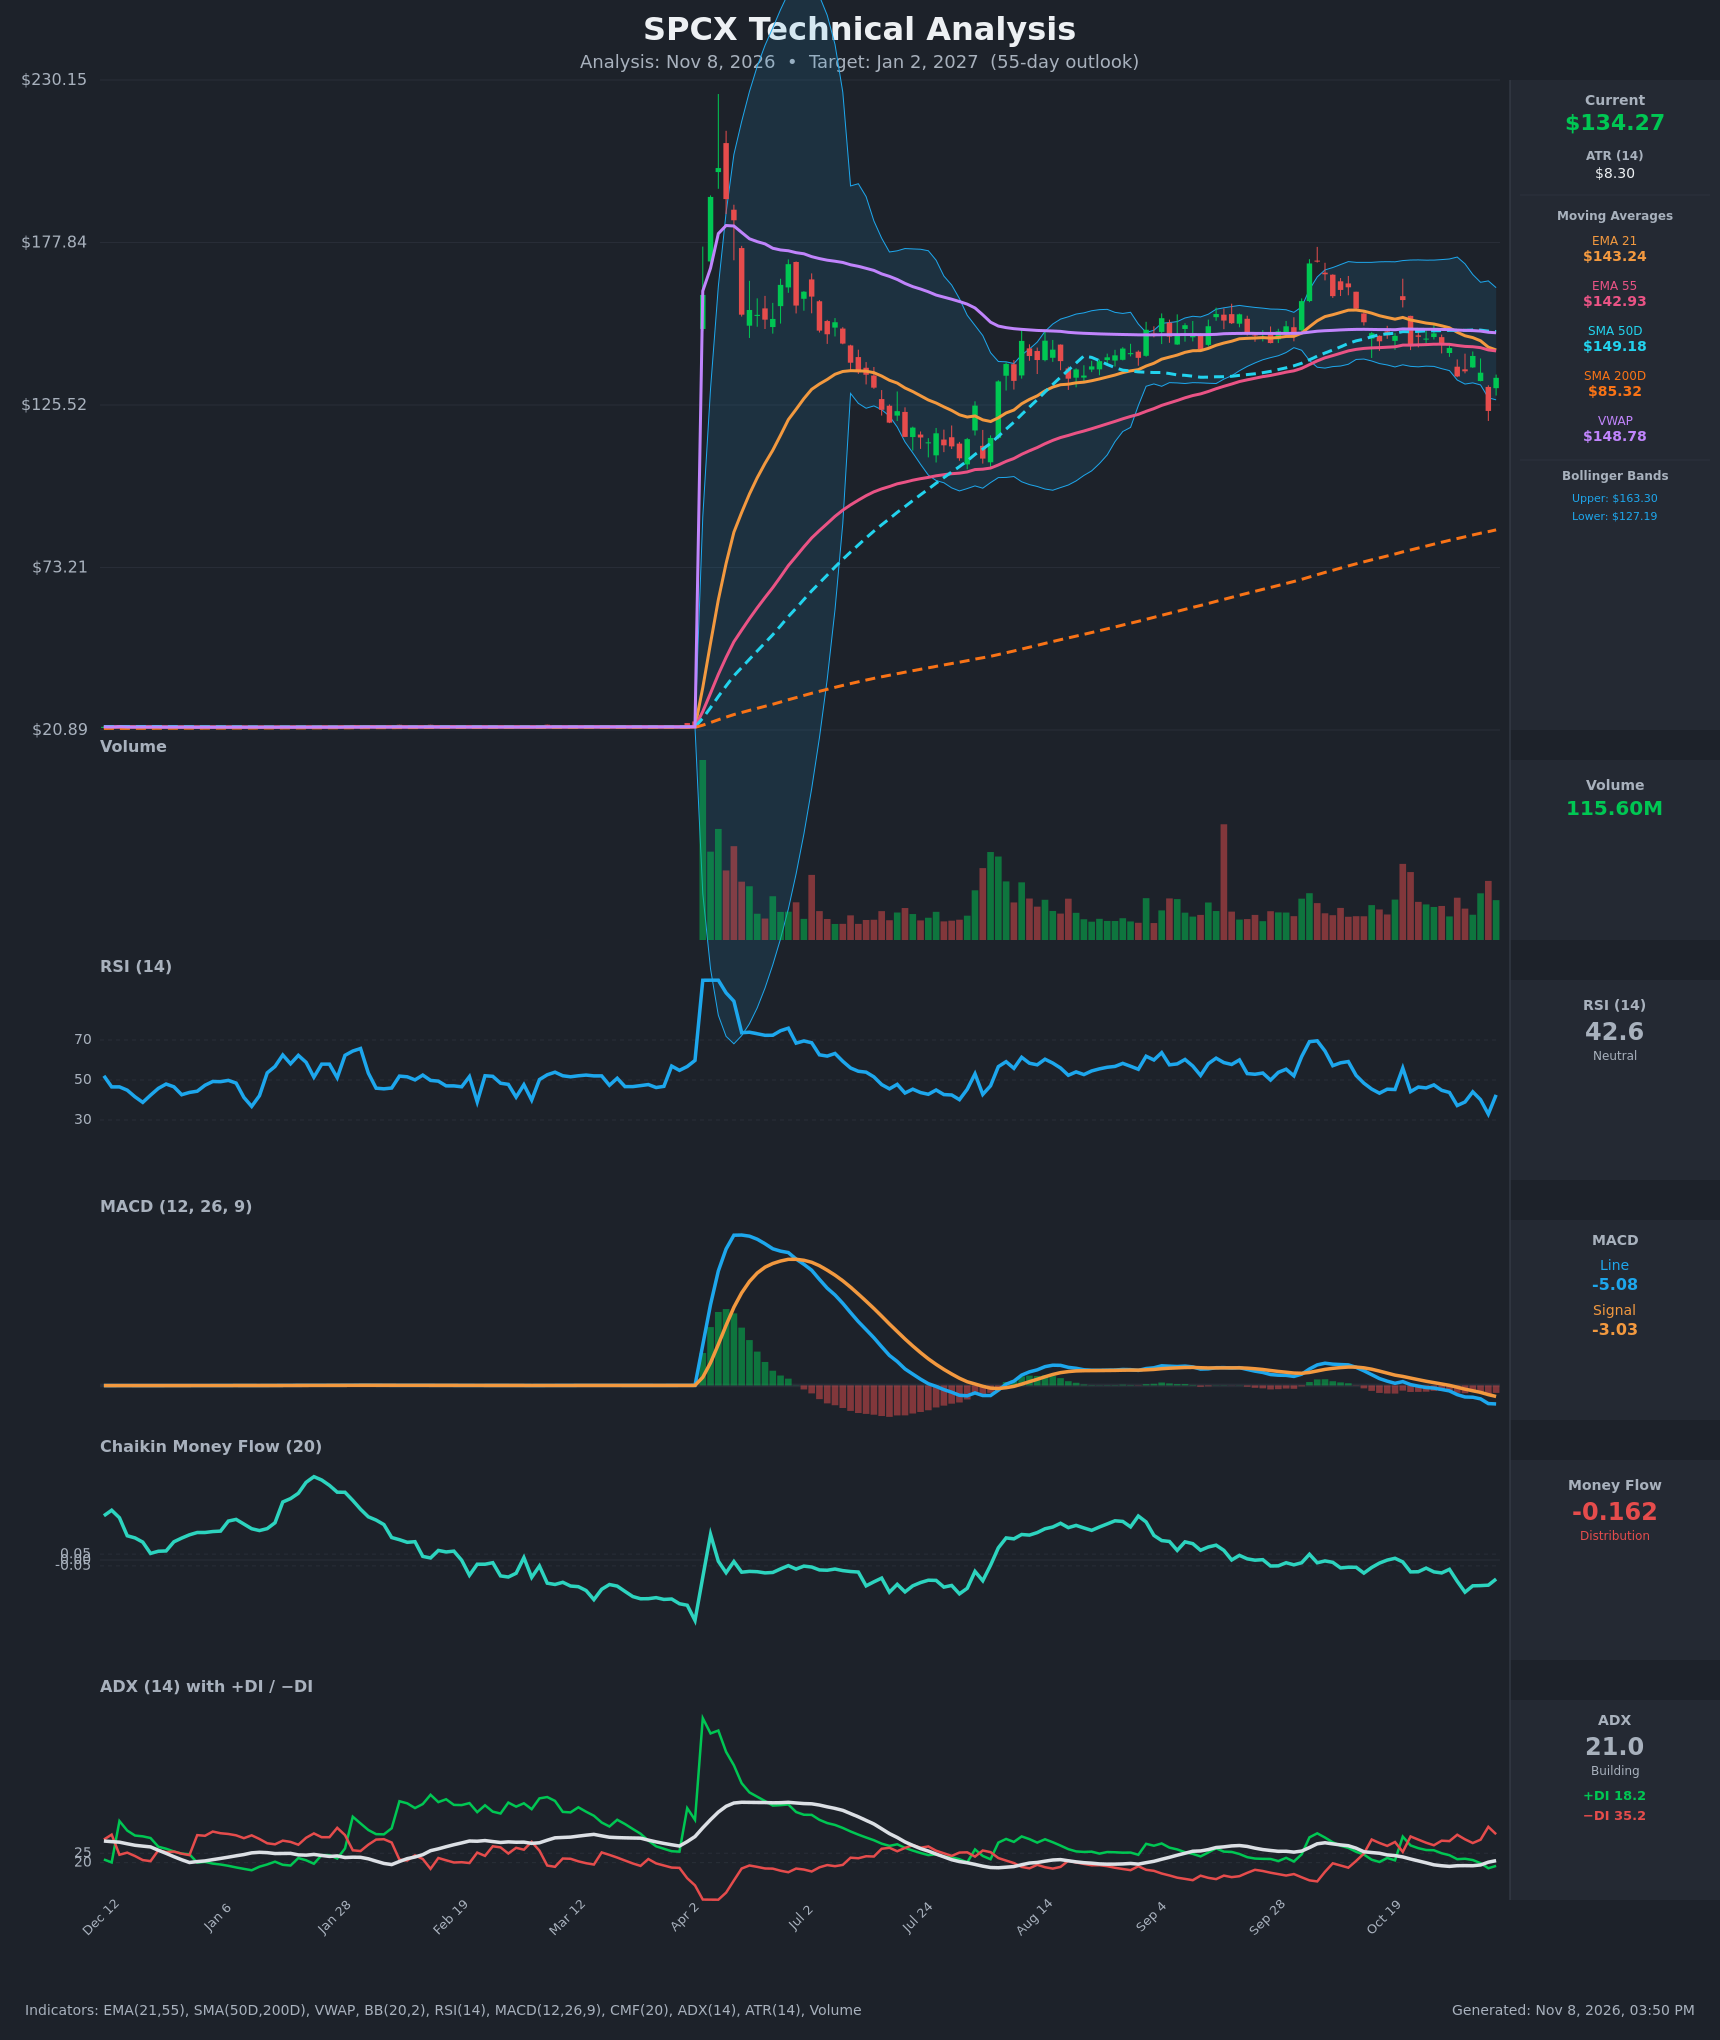
- RSI (14): 42.56. It bounced from 32.9 (near oversold) on Nov 5, but it is still below 50 and has made lower highs since the Oct 21 peak of 56. Momentum is weak with only a modest relief bounce. [Bearish]
- 20 EMA (EMA 21): $143.24, with price about 6.3% below it. The EMA has rolled over from $153.7 on Oct 21 and is acting as overhead resistance. It is also about to cross below the EMA 55 ($142.93), a bearish crossover. [Bearish]
- MACD: Line -5.08 is below Signal -3.03, and the bearish crossover dates to Oct 30. Both lines are negative and diverging, and the histogram is negative and expanding. This is a clear bearish momentum signal. [Bearish]
- Bollinger Bands (20): Upper $163.30, lower $127.19, midline about $145.2. Price sits in the lower third of the bands (%B ≈ 0.20) after tagging below the lower band on Nov 5 ($123.62). The bands are still wide, so volatility is elevated. This reflects a downtrend, not a squeeze. [Bearish]
- CMF (20): -0.162, well below the -0.05 threshold and the weakest of the 15 bars shown (it was -0.274 on Nov 2). This is sustained distribution. [Distribution]
- ADX (14): 21.0, rising from 18.0, with −DI (35.2) far above +DI (18.2). Trend strength is only starting to build, but the directional balance clearly favors sellers. [Weak-but-building Trend, Bearish]
- Volume: 115.60M, elevated against the recent baseline. The heaviest recent bars came on red down days (Oct 30, Nov 5), while the Nov 6 bounce is a partial recovery. Volume supports the sellers. [Bearish-leaning]
- Other levels: Price is below the SMA50D ($149.18) and VWAP ($148.78), which are both resistance. It is far above the SMA200D ($85.32), so the long-term structure is intact but extended. The SMA50D is rolling over, with no golden or death cross in sight.
DIVERGENCES & TRENDS
- There is no meaningful bullish divergence. RSI bounced from 32.9 to 42.6, but price is still well below its EMAs. MACD and CMF both made new lows with price, which confirms the decline.
- Lower highs on RSI (56 → 47.5 → 44 → 42.6) and a falling EMA 21 show a deteriorating trend.
- The EMA 21 is converging on the EMA 55 for a bearish cross. Price lost both on Oct 30 – Nov 5.
- The MACD bearish crossover (Oct 30) and the −DI / +DI separation (35 vs 18) are the key trend breaks.
- The chart shows the stock failed to hold the $140–$165 consolidation (Sep–Oct) and broke down through its lower edge.
- Price fell to $123.62 on Nov 5, then bounced to $134.27, so a relief bounce is underway.
- The July–August base near $108–$118 is the next major support zone below.
CHART PATTERNS
- Bearish Rectangle / Range Breakdown (closest to Bearish Triple Top): Price stalled several times in the $150–$165 area from Sep to Oct and has now lost the lower boundary around $140–$143. The measured move from the roughly $20 range height suggests a target near $120–$125.
- Possible Bearish Flag / Pennant: The current bounce from $123.62 to $134.27 is a corrective rally below the falling EMA 21 and EMA 55. A failure near $143 would complete a bear-flag-style continuation and aim at the prior base around $110–$118.
- Alternative reading, Bullish Double Bottom: Only valid if price reclaims $143 and holds. That is not the base case at present.
POTENTIAL SCENARIOS
- Scenario 1: Bearish Breakdown Continuation — The relief bounce fades below the EMA 21/EMA 55 cluster, MACD stays below its signal line, and sellers (−DI) stay in control. Trigger: rejection at $140–$143, or a daily close below $123.62. Target: $112–$120, with the Jul–Aug base near $108–$115 as an extension. Invalidation: daily close above $149 (SMA50D/VWAP). (50% probability)
- Scenario 2: Neutral Choppy Range — Price consolidates between the Nov 5 low and the EMAs while ADX stays near 20. Trigger: holds $123.62 support and fails to clear $143. Target: $125–$140 range-bound. Invalidation: close below $123 or above $149. (25% probability)
- Scenario 3: Bullish Recovery — A strong bounce reclaims the EMA 21/EMA 55 cluster and then the SMA50D and VWAP. Trigger: close above $143.24 with a rising CMF and a MACD histogram turning up. Target: $149–$155, then $163. Invalidation: close back below $127. (25% probability)
PRICE TARGETS
Timeframe: 55 days (target date around Jan 2, 2027). The range width is $22.00, or about 16.4% of the current price, which fits the 12–18% guidance for 30–60 days.
- Target Price: $124.50
- Expected Range: $113.00 to $135.00
- Key Levels: Support at $123.62, Resistance at $143.24
OVERALL BIAS
OVERALL BIAS: BEARISH - Price is below the EMA 21, EMA 55, SMA50D and VWAP. MACD is in a widening bearish crossover, CMF shows persistent distribution (-0.162), and −DI (35.2) dominates +DI (18.2) with ADX starting to rise. The current bounce looks corrective, and a retest of the $123.62 low with a drift toward the $113–$120 area is more likely than a recovery above $143.
This is educational analysis and not financial advice.