TLT 55-day bullish forecast — Nov 8, 2026
- Bias: Bullish
- Timeframe: 55 days (made Nov 8, 2026, target date Jan 1, 2027)
- Price at analysis: $81.92
- Price target: $83.40
- Expected range: $77.90 – $88.00
- Result: Pending — graded after the close on Jan 1, 2027
Get a free AI analysis of TLT today
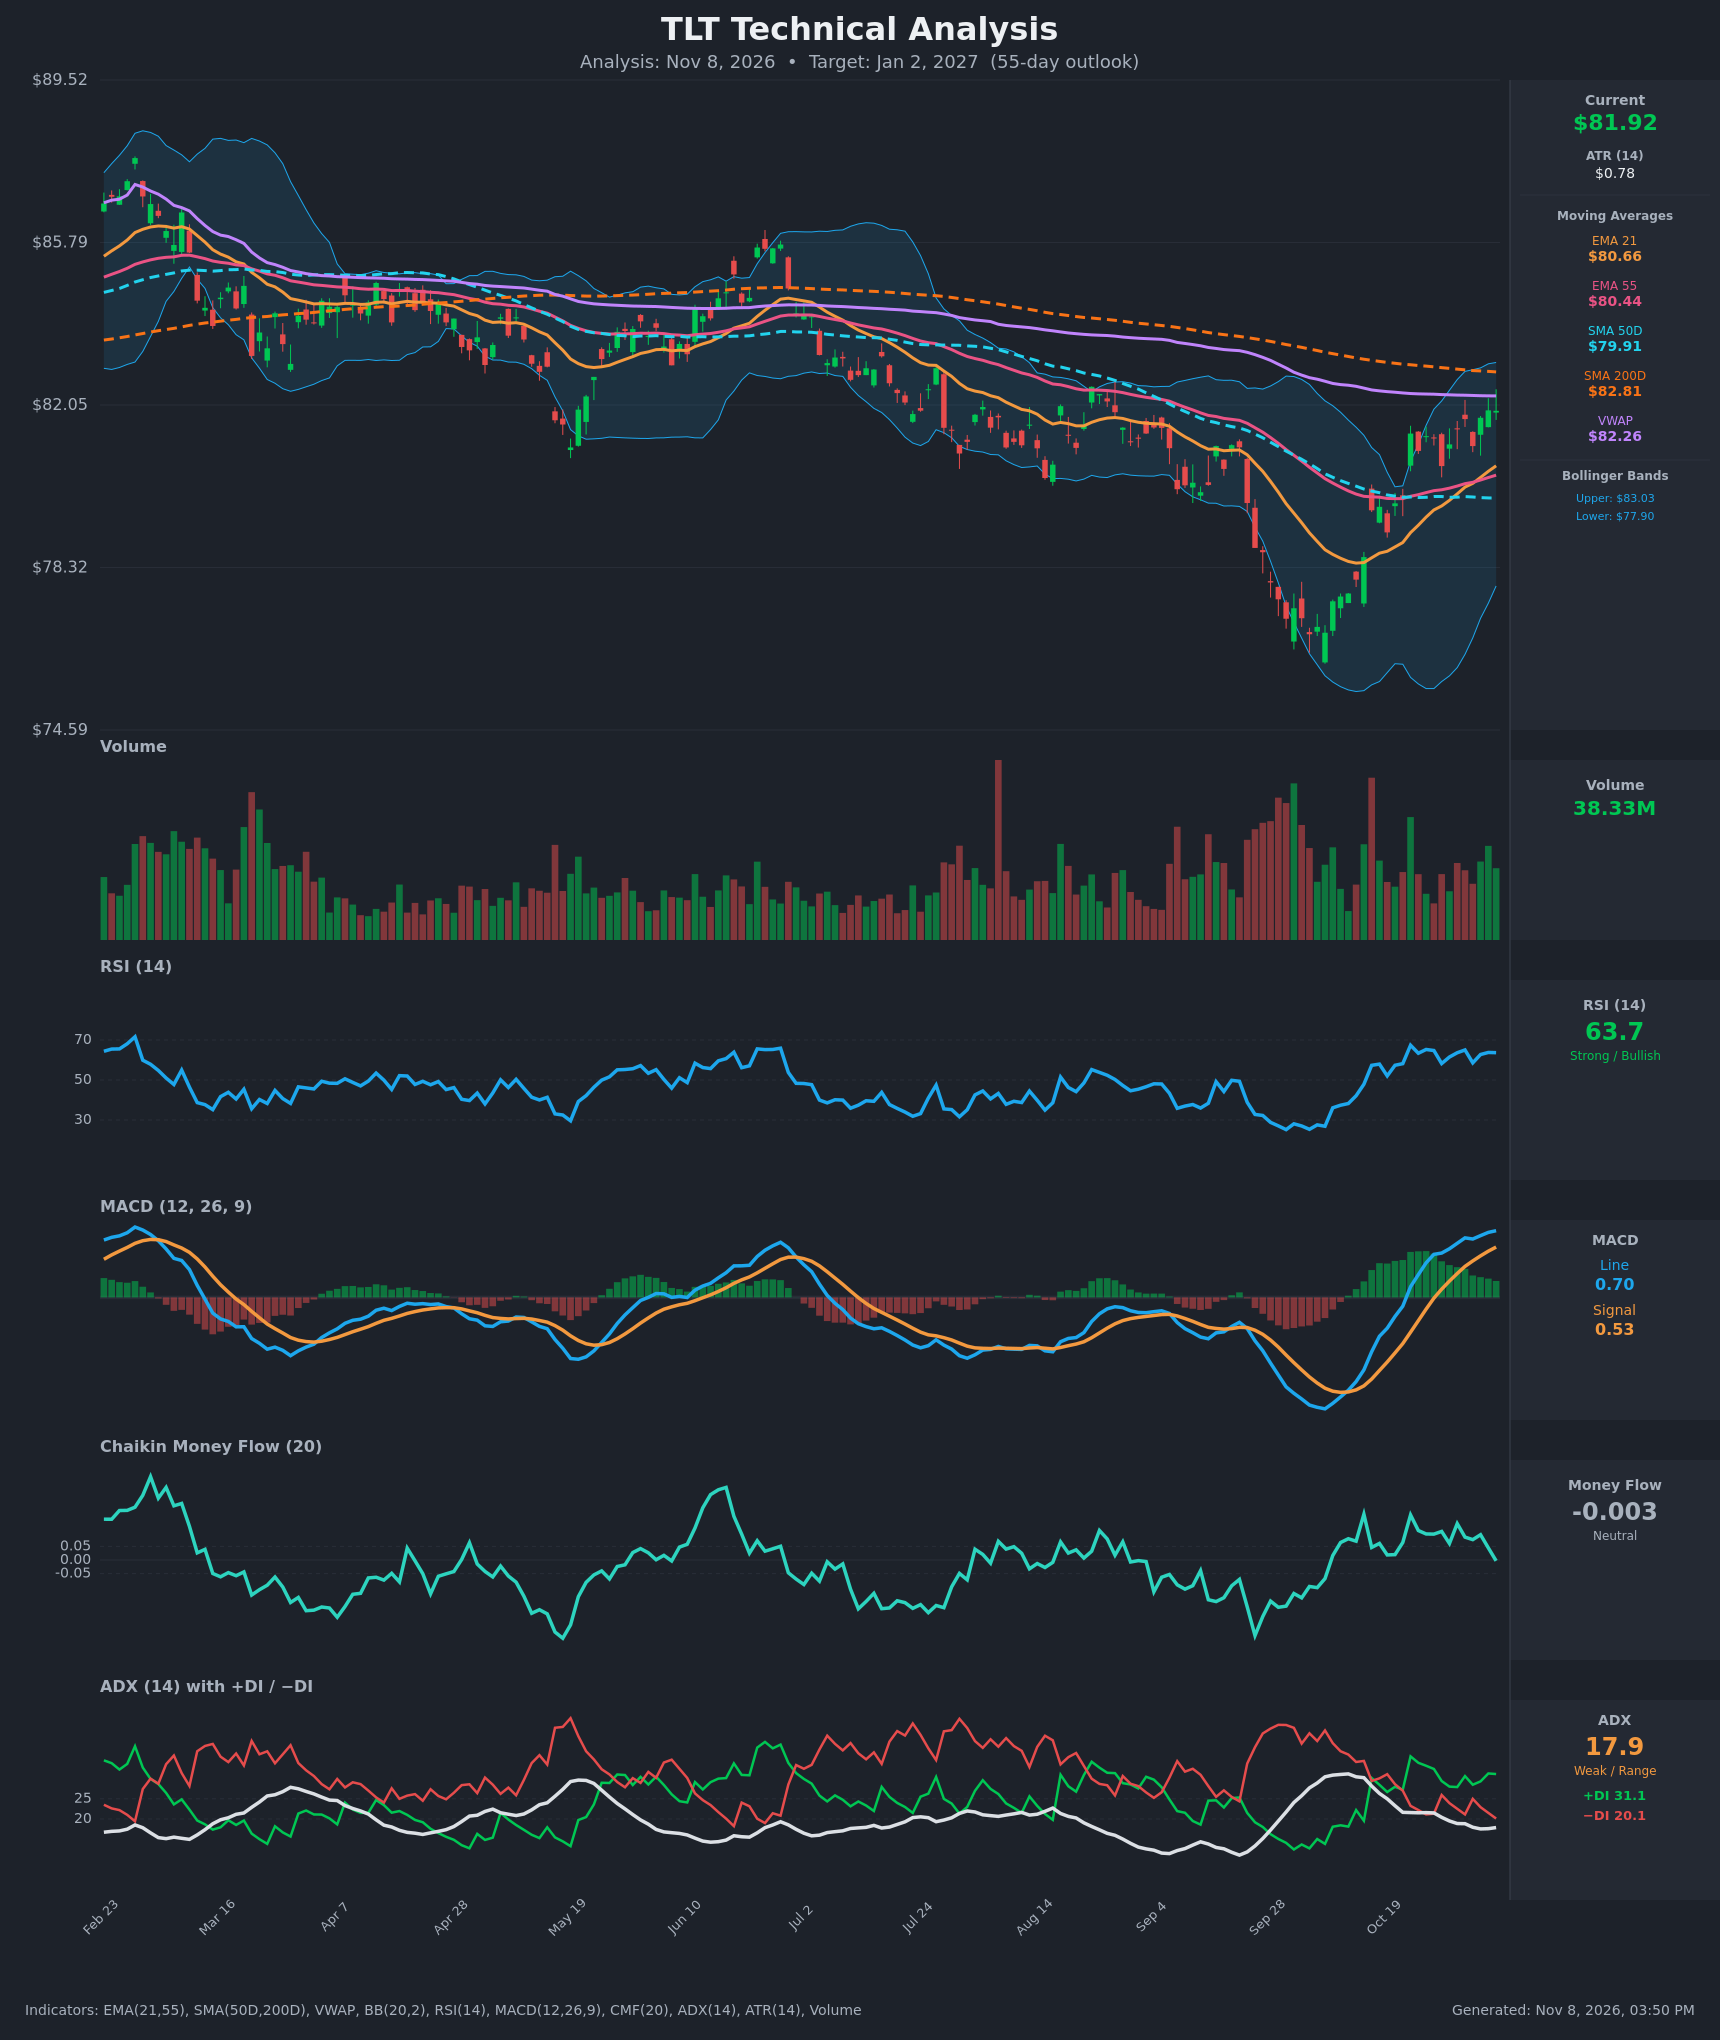
Analysis
TECHNICAL INDICATORS
- RSI (14): 63.66, in the upper-neutral/strong zone and below overbought. It has held in the 58-67 range for two weeks after rebounding from the high-20s in late September. Momentum is positive but flattening. [Bullish]
- 20 EMA (EMA 21 = $80.66): Price at $81.92 is about 1.6% above it, and the EMA is rising. EMA 21 crossed above EMA 55 ($80.44) on about Nov 4, a fresh bullish crossover. Both EMAs now act as dynamic support. [Bullish]
- MACD: Line 0.70 is above signal 0.53, with a positive histogram of about +0.17. The bullish crossover happened Oct 22-27 and both lines are rising above zero. The histogram has been narrowing slightly in recent bars. [Bullish]
- Bollinger Bands (20): Upper $83.03, lower about $77.90, midline near $80.46. Price sits in the upper half of the bands, about $1.1 below the upper band. The bands have widened after the September selloff and are now curling sideways. There is room to run, but the $83 area is the ceiling. [Bullish]
- CMF (20): -0.003, neutral. It has faded from +0.13 on Oct 30 to about zero, so buying pressure is fading as price grinds up into resistance. This is a mild warning. [Neutral]
- ADX (14): 17.9 and falling, so the trend is weak or range-bound. +DI (31.1) is above −DI (20.1), so bulls have directional control but without trend strength. [Weak Trend + Bullish lean]
- Volume: 38.33M, around average. Recent up days have had decent volume, but there is no breakout surge. Distribution volume from the September selloff is well behind us. [Neutral to mildly Bullish]
DIVERGENCES & TRENDS
- Long-term trend: Price ($81.92) is below SMA200 ($82.81), and SMA50 ($79.91) is below SMA200. That is a death-cross structure, so the larger trend is still down or corrective. The SMA200 has been falling steadily since February.
- Short-term trend: Price is above EMA21, EMA55 and SMA50, with EMA21 recently crossing above EMA55. This is a clear short-term trend turn.
- Overhead resistance cluster: VWAP ($82.26), SMA200 ($82.81) and the upper Bollinger Band ($83.03) all sit within about $1.1 of price.
- Mild divergence: CMF has fallen from +0.13 to about 0 while price made a marginally higher high at $81.93. This points to waning accumulation.
- MACD and ADX: MACD is making higher highs, but ADX is falling toward 17-18. The rally is not yet a trending move.
- RSI: It has been stable around 63-65 without reaching overbought, so the rally has room.
- DI: +DI has been above −DI since Oct 22, a bullish control signal.
CHART PATTERNS
- Bullish reversal/recovery base: After the September low near $76.5, price made a V-shaped recovery. The sharp decline into the low reads like a Bullish Falling Wedge / Expanding Triangle resolving upward. The breakout has carried price back through the 50-day and EMAs.
- Larger context: The multi-month structure since February is a descending channel of lower highs, with price capped by the declining SMA200.
- Pattern targets: A clean break above $83 would open a measured-move area of $84.5-85.5. That is the prior consolidation zone around $84-85 and would also be a test of the upper channel.
- Failure case: A rejection at $82.8-83.0 would resemble a Bearish Rising Wedge/Pennant within the larger downtrend. That would bring a retest of $80.4-79.9.
POTENTIAL SCENARIOS
- Scenario 1: Bullish Breakout Above the 200-day — Price pushes through the VWAP/SMA200/upper-band cluster as momentum and the fresh EMA crossover carry the recovery. Trigger: daily close above $83.05 on rising volume with CMF back above +0.05. Target: $84.50-$85.50. Invalidation: close back below $80.40 (EMA55/EMA21). (45% probability)
- Scenario 2: Bearish Rejection and Pullback — Resistance at $82.3-83.0 holds, CMF turns negative, and price fades back toward the moving-average support in a continuation of the longer-term downtrend. Trigger: failure at $83 and a close below $80.40. Target: $79.90 (SMA50), then $78.00-$77.90 (lower band). Invalidation: close above $83.10. (35% probability)
- Scenario 3: Neutral Chop Under the 200-day — With ADX below 20, price oscillates between $80.0 and $83.0 for most of the window. Trigger: repeated failures at $82.8 with support holding at $80.4. Target: $81-$82.5. Invalidation: a decisive close outside $79.9-$83.1. (20% probability)
PRICE TARGETS
- Target Price: $83.40 (55-day horizon, around Jan 2, 2027)
- Expected Range: $77.90 to $88.00 (width of $10.10, about 12.3% of current price, consistent with the 30-60 day guidance of 12-18%)
- Key Levels: Support at $80.44 (EMA 55, with EMA 21 at $80.66 just above), Resistance at $82.81 (SMA200, with VWAP at $82.26 and upper Bollinger Band at $83.03 just beyond)
OVERALL BIAS
OVERALL BIAS: BULLISH - Price has reclaimed the EMAs and SMA50, the EMA21/EMA55 crossover and the MACD crossover are both bullish, and +DI is above −DI with RSI in the low 60s. Conviction is modest because price is still below the falling SMA200 and VWAP, ADX is weak, and CMF has faded to zero, so a rejection near $83 is a real risk.
This is educational analysis and not financial advice.