TSLA 55-day bearish forecast — Nov 8, 2026
- Bias: Bearish
- Timeframe: 55 days (made Nov 8, 2026, target date Jan 1, 2027)
- Price at analysis: $358.22
- Price target: $340.00
- Expected range: $316.00 – $372.00
- Result: Pending — graded after the close on Jan 1, 2027
Get a free AI analysis of TSLA today
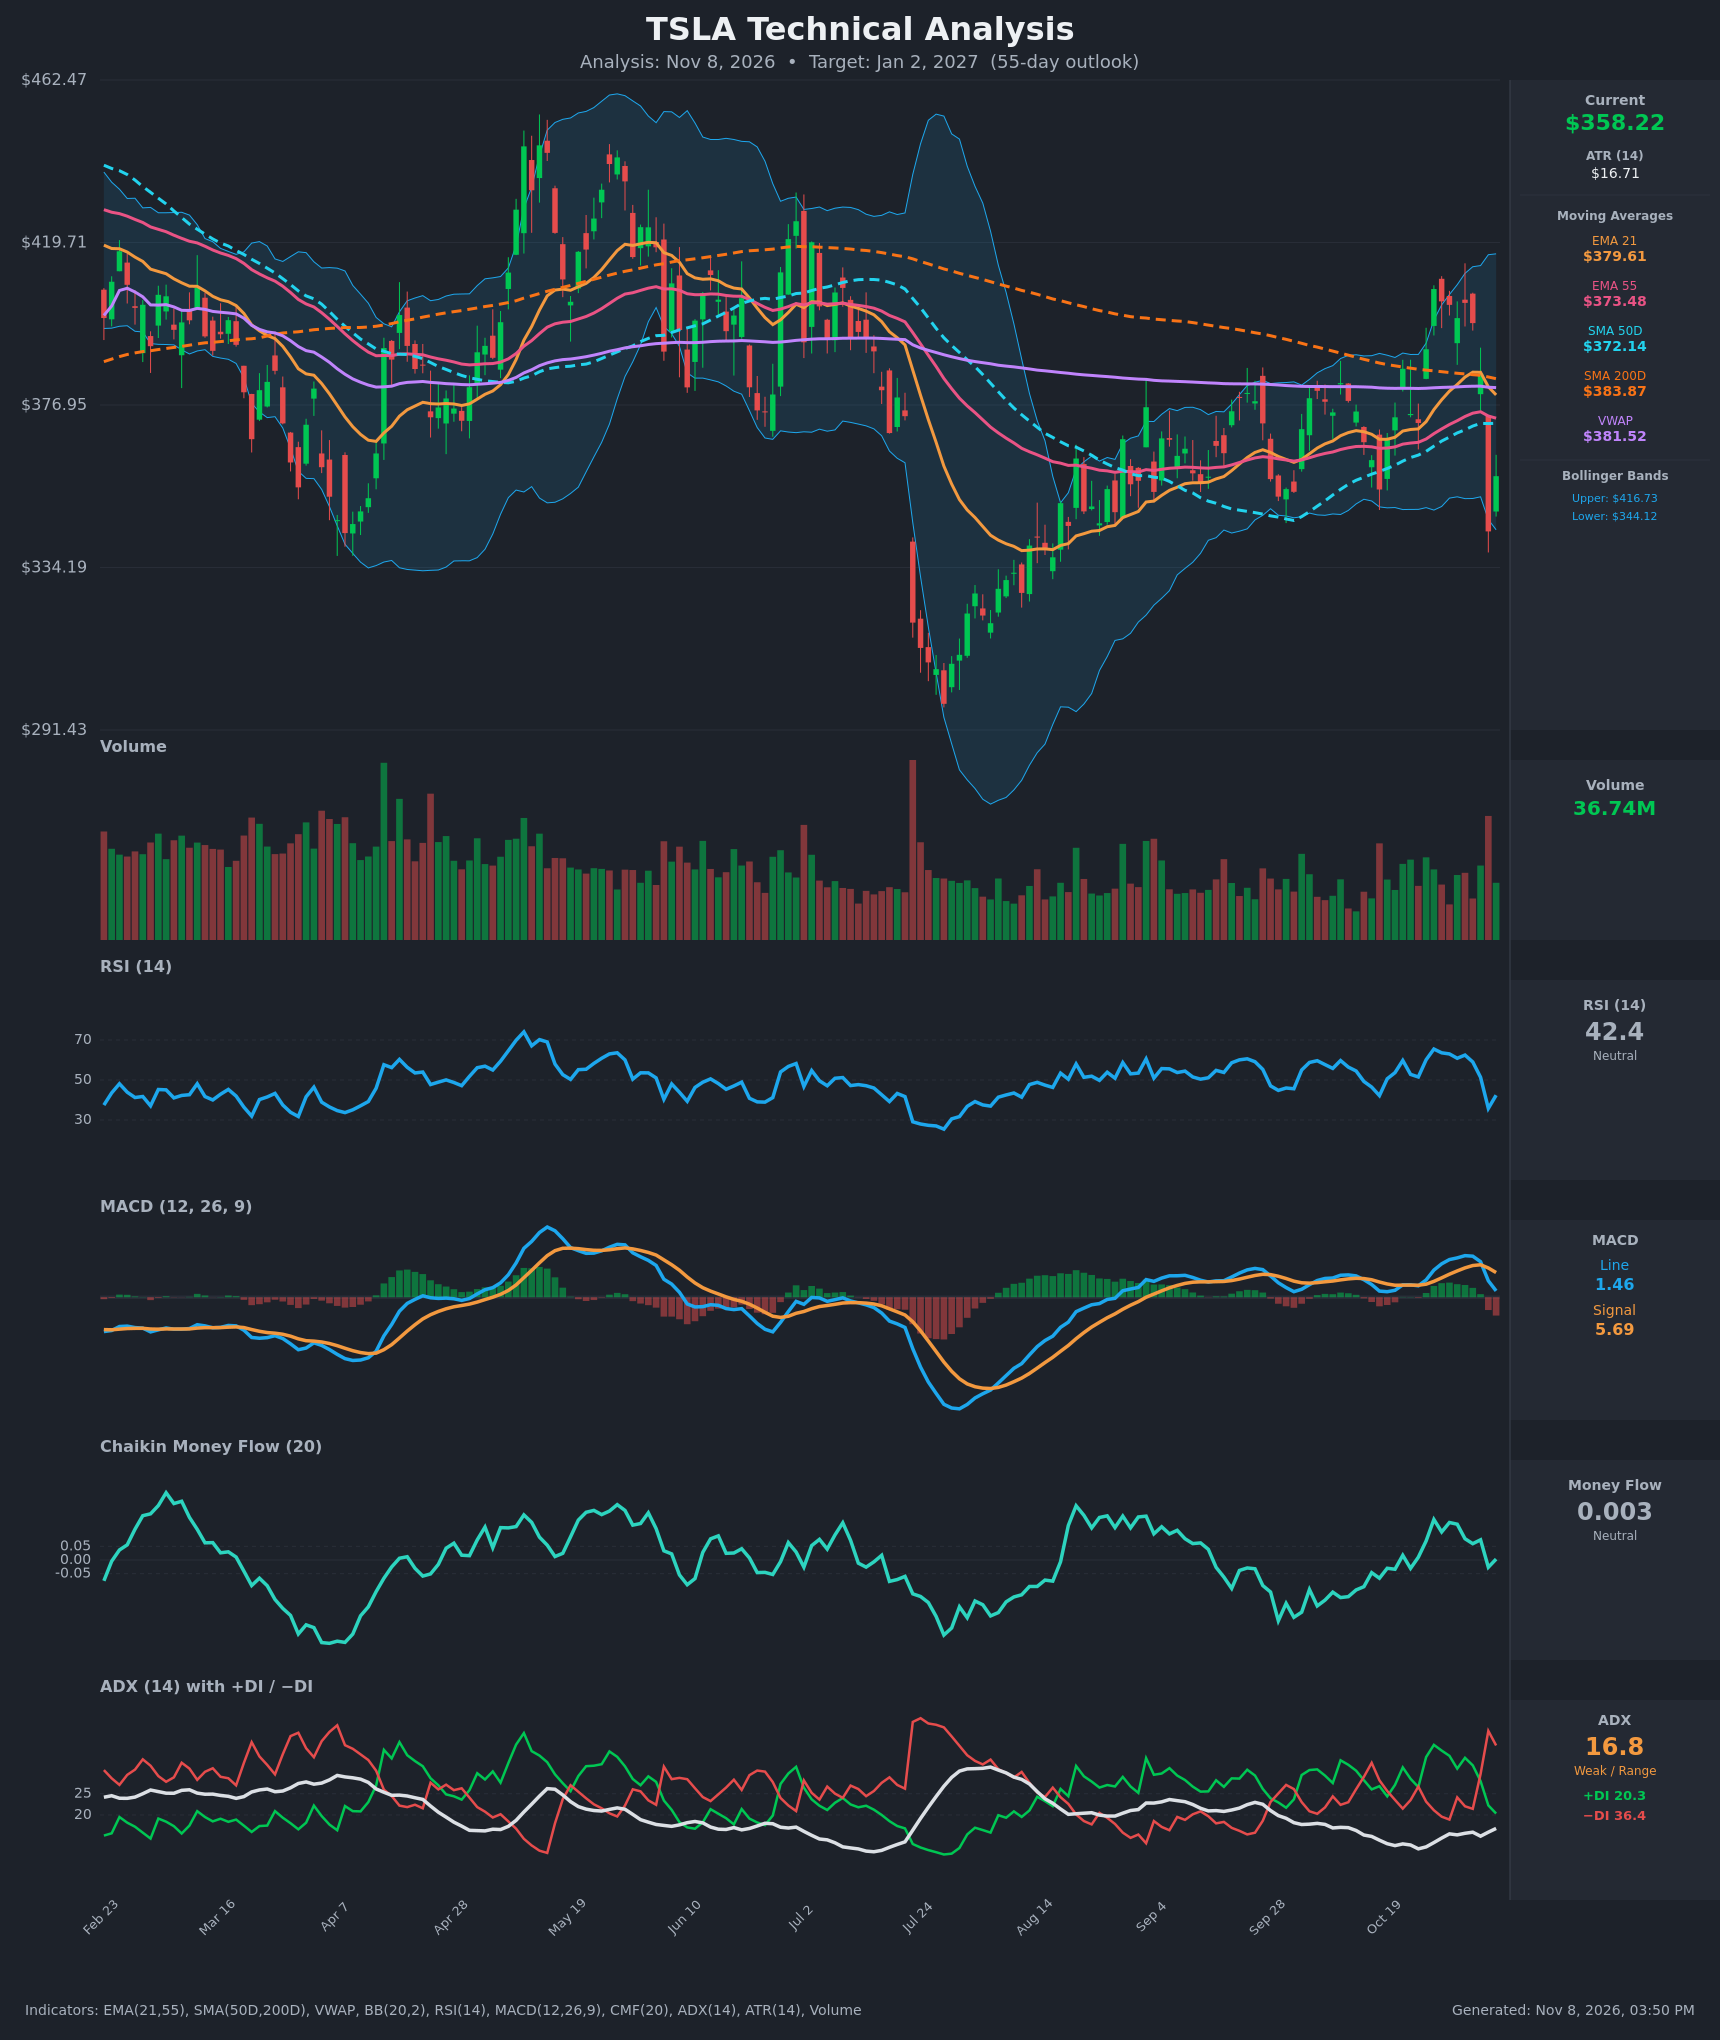
Analysis
TECHNICAL INDICATORS
- RSI (14): 42.39, down from 62.5 on Nov 2 and a low of 35.8 on Nov 5. The bounce to 42 is a weak recovery and RSI is still below the 50 midline, so momentum has shifted to sellers without being oversold. [Bearish]
- 20 EMA: The 21 EMA is at $379.61 and falling, and price at $358.22 is about 5.6% below it, so it is now overhead resistance. The 21 EMA is still above the 55 EMA ($373.48), but the gap has narrowed from about $11 to about $6, so a bearish cross is approaching. [Bearish]
- MACD: The line (1.46) crossed below the signal (5.69) on Nov 5, and the histogram is negative and widening (about -4.2). The line is close to zero, so the bullish impulse from late October has been erased. [Bearish]
- Bollinger Bands (20): Upper $416.73, lower $344.12, midline near $380. Price sits at about 19% of the band width, in the lower half, after a sharp two-day drop from the upper half. The bands are wide (~20% of price), so volatility is elevated. The $344 lower band is the nearest support. A bounce off it would target the midline near $380, which is also the overhead resistance cluster. [Bearish]
- CMF (20): 0.003, inside the ±0.05 neutral zone. It fell from +0.149 on Oct 27 to slightly negative on Nov 5, so accumulation has faded, but it hasn't turned into outright distribution. [Neutral]
- ADX (14): 16.8, below 20, so there is no established trend. −DI (36.4) is well above +DI (20.3), and the DI crossover to the bear side on Nov 4-5 shows sellers currently control the short-term direction. ADX is rising slightly from 15. [Weak Trend, bearish lean]
- Volume: 36.74M on the bounce day, lower than the large-volume selloff bar on Nov 5. The heavy-volume red candle is a distribution-style signal. The bounce on lighter volume lacks strong buyer follow-through. [Bearish]
Moving-average context:
- Price is below the 21 EMA, 55 EMA, SMA50D ($372.14), SMA200D ($383.87) and VWAP ($381.52).
- SMA50D is below SMA200D, so the death-cross regime has been in place since mid-year. The 200D is still falling.
DIVERGENCES & TRENDS
- There is no clear bullish divergence. Price retested the $343-345 area and RSI made a higher low (35.8, versus about 26 at the July low), which is an improvement but not an actionable divergence.
- There is a bearish sequence from the Oct 27 high: RSI fell from 65.5 to 42, the MACD histogram turned negative, and −DI overtook +DI. The late-October rally to $407 failed below the 200D/VWAP cluster and was fully retraced in about 7 sessions. This pattern looks like a failed breakout (bull trap).
- The bearish MACD cross on Nov 5 was confirmed by the −DI/+DI flip.
- ADX under 20 for most of the period since August shows a choppy, range-bound market (roughly $343-$407) rather than a trending one. This limits how far the downside can run.
- The EMA21/EMA55 spread is compressing, so a bearish EMA cross is likely within days if price stays below $370.
CHART PATTERNS
- Bearish Double Top (reference diagram): The peaks at about $407 (Oct 27) and about $404 (Nov 2) formed a double top with a neckline near $385. The neckline broke on Nov 5 on heavy volume. The measured move (about $22) projects to roughly $363, which has already been reached, so the pattern is mostly "used up" and now acts as overhead resistance for any bounce.
- Wider range / failed breakout: Since August, price has oscillated between about $343-$350 and $405-$410. The Oct rally failed at the top of this rectangle and the SMA200 area. The base of the range at $343-$345 is the key level. A close below it would be a break of the range and point toward the $315-$325 zone (about one ATR-multiple below, with the July low near $300 as deeper support).
- Bearish bias to the pattern: Lower highs on the multi-month view ($440 in May, $420 in July, $407 in Oct), with price below a declining 200D, are consistent with a bearish triple-top-style distribution on the larger timeframe.
POTENTIAL SCENARIOS
- Scenario 1: Bearish Range Breakdown — Failure at the 21/55 EMA and SMA50 cluster, then a slide to retest and break the $343-$345 range floor. Trigger: daily close below $343.69 with expanding volume, or a rejection at $372-$374. Target: $318-$335. Invalidation: daily close above $384 (SMA200/VWAP). (45% probability)
- Scenario 2: Bullish Range Recovery — The $343-$345 floor holds again, RSI recovers above 50, and price squeezes back into the range middle. Trigger: close above $374 (EMA55/SMA50) followed by the 21 EMA and $384. Target: $385-$400. Invalidation: close below $343. (33% probability)
- Scenario 3: Neutral Chop — Price grinds in a $345-$378 band for the full period with weak ADX. Trigger: repeated holds at $345 with rejections near $375. Target: $350-$370. Invalidation: close beyond either side of the band. (22% probability)
PRICE TARGETS
- Target Price: $340.00 (55-day horizon, about 5.1% below current price)
- Expected Range: $316.00 to $372.00 (width $56, about 15.6% of current price, consistent with the 30-60 day guidance of 12-18%)
- Key Levels: Support at $343.69, Resistance at $372.14
OVERALL BIAS
OVERALL BIAS: BEARISH - Price is below every major moving average and VWAP. The MACD crossed down and −DI dominates +DI. The heavy-volume Nov 5 selloff followed a failed breakout at $407. The weak ADX and the $343 range floor limit the downside, so the target is a modest decline toward the range low or a break below it.
This is educational analysis and not financial advice.