WMT 55-day bullish forecast — Nov 8, 2026
- Bias: Bullish
- Timeframe: 55 days (made Nov 8, 2026, target date Jan 1, 2027)
- Price at analysis: $125.52
- Price target: $128.50
- Expected range: $116.50 – $135.00
- Result: Pending — graded after the close on Jan 1, 2027
Get a free AI analysis of WMT today
Analysis
TECHNICAL INDICATORS
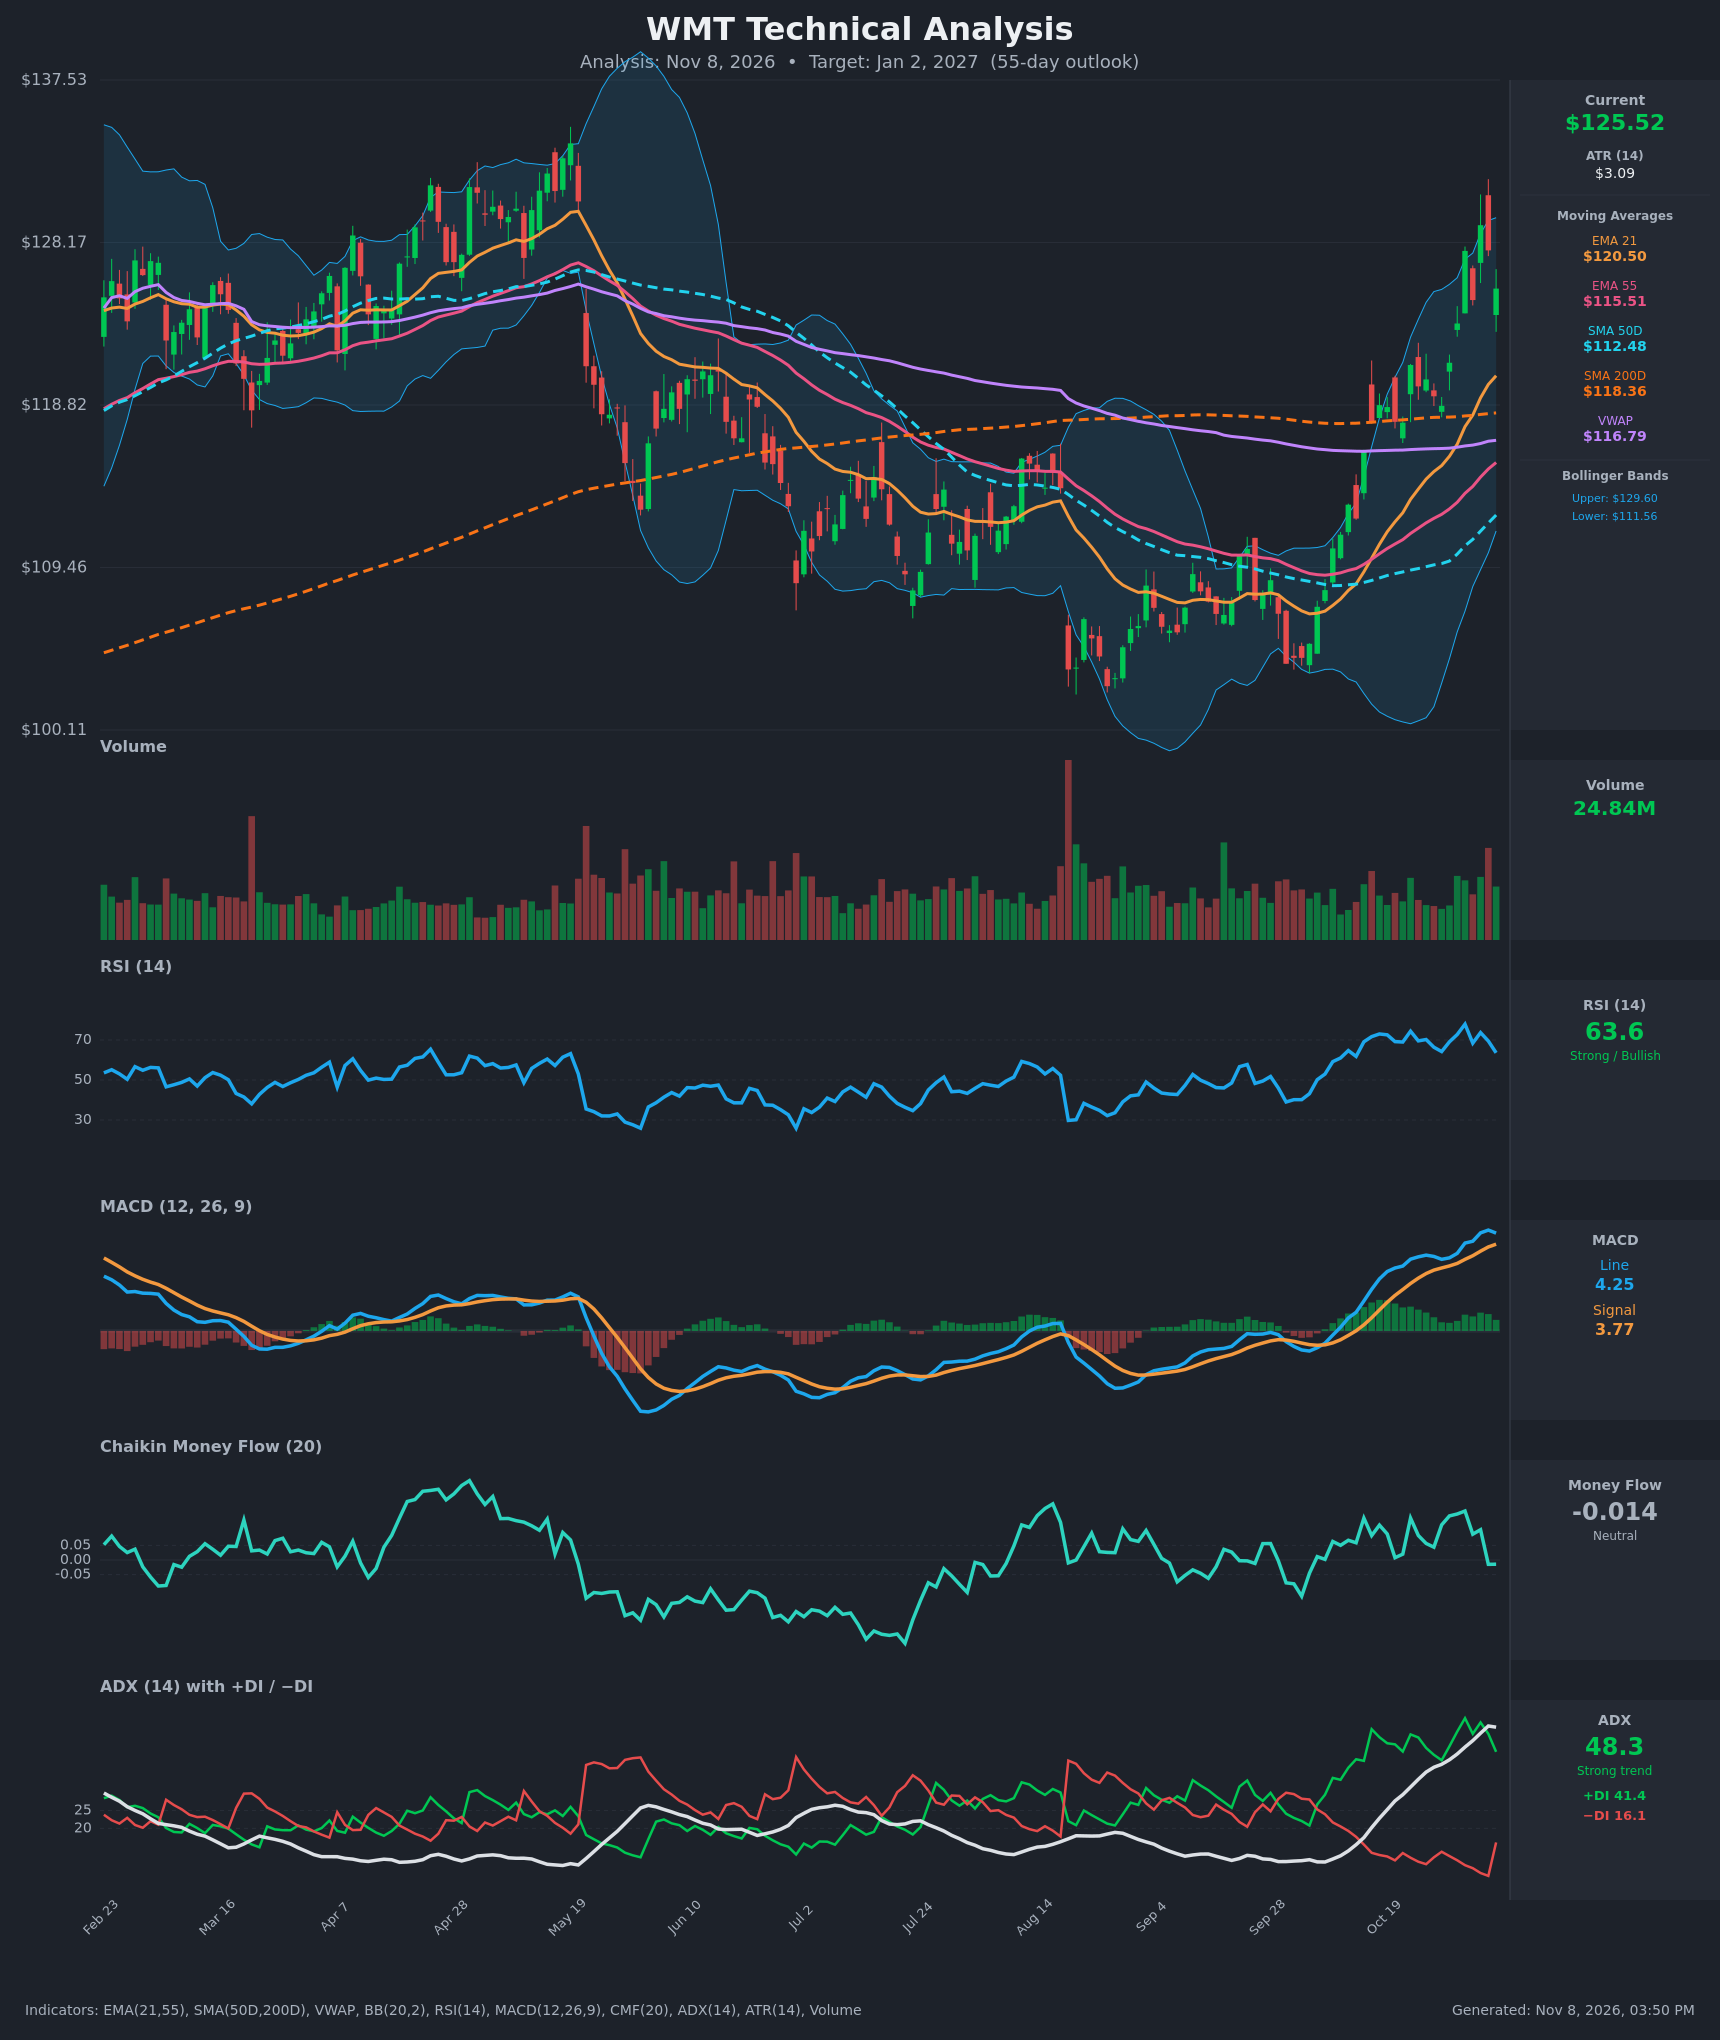
- RSI (14): 63.6, down from a 77.9 peak on Nov 2 and 73.7 on Nov 4. It has cooled out of overbought territory while staying well above 50. The trend of lower RSI peaks against higher price peaks (129.17 vs 127.69) is mild momentum fatigue, not a breakdown. [Bullish]
- 20 EMA: The data gives EMA 21 at $120.50 and EMA 55 at $115.51. Price at $125.52 is about 4.2% above the EMA 21, which has been rising steadily and is the first dynamic support. EMA 21 is well above EMA 55 (bullish stack), and price is above SMA 50D ($112.48), SMA 200D ($118.36) and VWAP ($116.79). The stretch above the EMA 21 raises odds of a mean-reversion pullback. [Bullish]
- MACD: Line 4.25 is above signal 3.77, both well above zero. The histogram is about +0.48, down from about +0.73 on Nov 5 and +0.80 on Nov 4, so momentum is flattening and the line ticked down for the first time in the rally. There is no bearish cross yet, but the line is rolling over. [Bullish]
- Bollinger Bands (20): Upper $129.60, lower $111.56, with the midline near $120.5. Price is in the upper third of the bands after tagging the upper band on Nov 4 ($129.17) and pulling back. The bands are wide after the expansion, which reflects a strong trend rather than a squeeze. A "walk the band" move and a pullback to the midline are both plausible. [Bullish]
- CMF (20): -0.014, in the neutral zone. It fell from +0.168 on Nov 2 to slightly negative, so buying pressure has faded on the latest pullback. The rally is not being confirmed by fresh accumulation, which is a caution flag. [Neutral]
- ADX (14): 48.3 with +DI 41.4 and −DI 16.1. This is a very strong, mature uptrend with bulls firmly on top. The ADX has just flattened (48.6 → 48.3) and −DI jumped from 6.7 to 16.1 on the red candle. Readings above 45 often mark trend maturity, so expect consolidation or a pullback before further gains. [Strong Trend + Up]
- Volume: 24.84M, which is elevated. The last red candle on Nov 6 came on one of the larger volume bars in the recent sequence, a mild distribution hint. The rally itself, from Oct 28 on, was supported by above-average volume. [Constructive but watch the heavy down bar]
DIVERGENCES & TRENDS
- Mild bearish divergence: price made a higher high at $129.17 (Nov 4) while the RSI peak was lower than on Nov 2 (73.7 vs 77.9). The MACD histogram is shrinking and CMF has faded from +0.17 to about -0.01 while price sits near highs.
- Trend structure: EMA 21 crossed above EMA 55 earlier in the move and the gap is widening, so the trend is intact.
- SMA 50D vs SMA 200D: SMA 50D ($112.48) is still below SMA 200D ($118.36), so there is no golden cross yet. The gap has narrowed from about $8.9 on Oct 19 to about $5.9, so a golden cross is plausible within the 55-day window if price holds up.
- Price above SMA 200D: the break above the 200-day (~$118) in late October was a major long-term trend shift from the prior downtrend.
- DI/ADX: +DI is dominant, but −DI's jump from 6.7 to 16.1 shows sellers re-emerging on the last bar.
- MACD: still above signal, but the line has turned down from its Nov 5 high. A bearish cross would need a deeper pullback.
CHART PATTERNS
- Bullish Double Bottom (reversal): the Aug–Sep lows near $103–105 form a double bottom, and the late-October rally broke through the neckline (~$117–118, which coincides with the SMA 200D). The measured move is about $118 + ($118 − $103) ≈ $133, which supports upside potential over the medium term.
- Possible short-term Bearish Double Top: the Nov 2 ($127.69) and Nov 4 ($129.17) highs resemble a small double top. Confirmation would need a break below the intermediate trough near $124.9 and then the EMA 21 ($120.5). It is not confirmed, and the broader trend context favors a bullish flag or consolidation instead.
- Bullish Flag possibility: after a sharp impulse leg from ~$104 to $129, a shallow pullback toward $120–124 would form a flag. A breakout above $129–130 would project toward $135+.
POTENTIAL SCENARIOS
- Scenario 1: Bullish Pullback-and-Continuation — The trend is very strong (ADX 48, +DI dominant). Price likely digs into $120–124 (EMA 21 area) to reset overbought conditions, then resumes higher as the golden cross nears. Trigger: hold above the EMA 21 (~$120.5) and a close above $129.60 (upper BB / recent high). Target: $133–$135, with a base-case 55-day target near $128.50. Invalidation: a daily close below $115.50 (EMA 55) and a MACD bearish cross. (50% probability)
- Scenario 2: Bearish Trend Exhaustion Reversal — Mature ADX, fading CMF, lower RSI peaks and the heavy red candle point to a top. The double top confirms and price retraces to the SMA 200D and VWAP area. Trigger: close below $120.50 and a MACD bearish crossover. Target: $116–$118 (SMA 200D / VWAP), extending to $112.50 (SMA 50D). Invalidation: a close above $130. (30% probability)
- Scenario 3: Neutral Consolidation — Price digests the rally in a $119–$130 range while the MAs catch up. Trigger: ADX rolling over from the 48 area with price oscillating around the $120.5–$129 zone. Target: $122–$127. Invalidation: a close beyond either boundary. (20% probability)
PRICE TARGETS
- Target Price: $128.50 (55-day horizon, about Jan 2, 2027)
- Expected Range: $116.50 to $135.00 (width $18.50, about 14.7% of current price, consistent with the 30–60 day guidance of 12–18%)
- Key Levels: Support at $120.50 (EMA 21), Resistance at $129.60 (upper Bollinger Band / recent high at $129.17)
OVERALL BIAS
OVERALL BIAS: BULLISH - Price is above every moving average with a very strong ADX (48.3, +DI 41.4 vs −DI 16.1), a positive MACD and a double-bottom breakout through the SMA 200D, pointing to a measured-move target in the low-to-mid $130s. Near-term exhaustion signals (fading RSI, shrinking histogram, neutral CMF) argue for a pullback toward the $120.50 EMA 21 first, so conviction is moderate.
This is educational analysis and not financial advice.