XLE 55-day bearish forecast — Nov 8, 2026
- Bias: Bearish
- Timeframe: 55 days (made Nov 8, 2026, target date Jan 1, 2027)
- Price at analysis: $61.62
- Price target: $59.50
- Expected range: $56.00 – $66.00
- Result: Pending — graded after the close on Jan 1, 2027
Get a free AI analysis of XLE today
Analysis
TECHNICAL INDICATORS
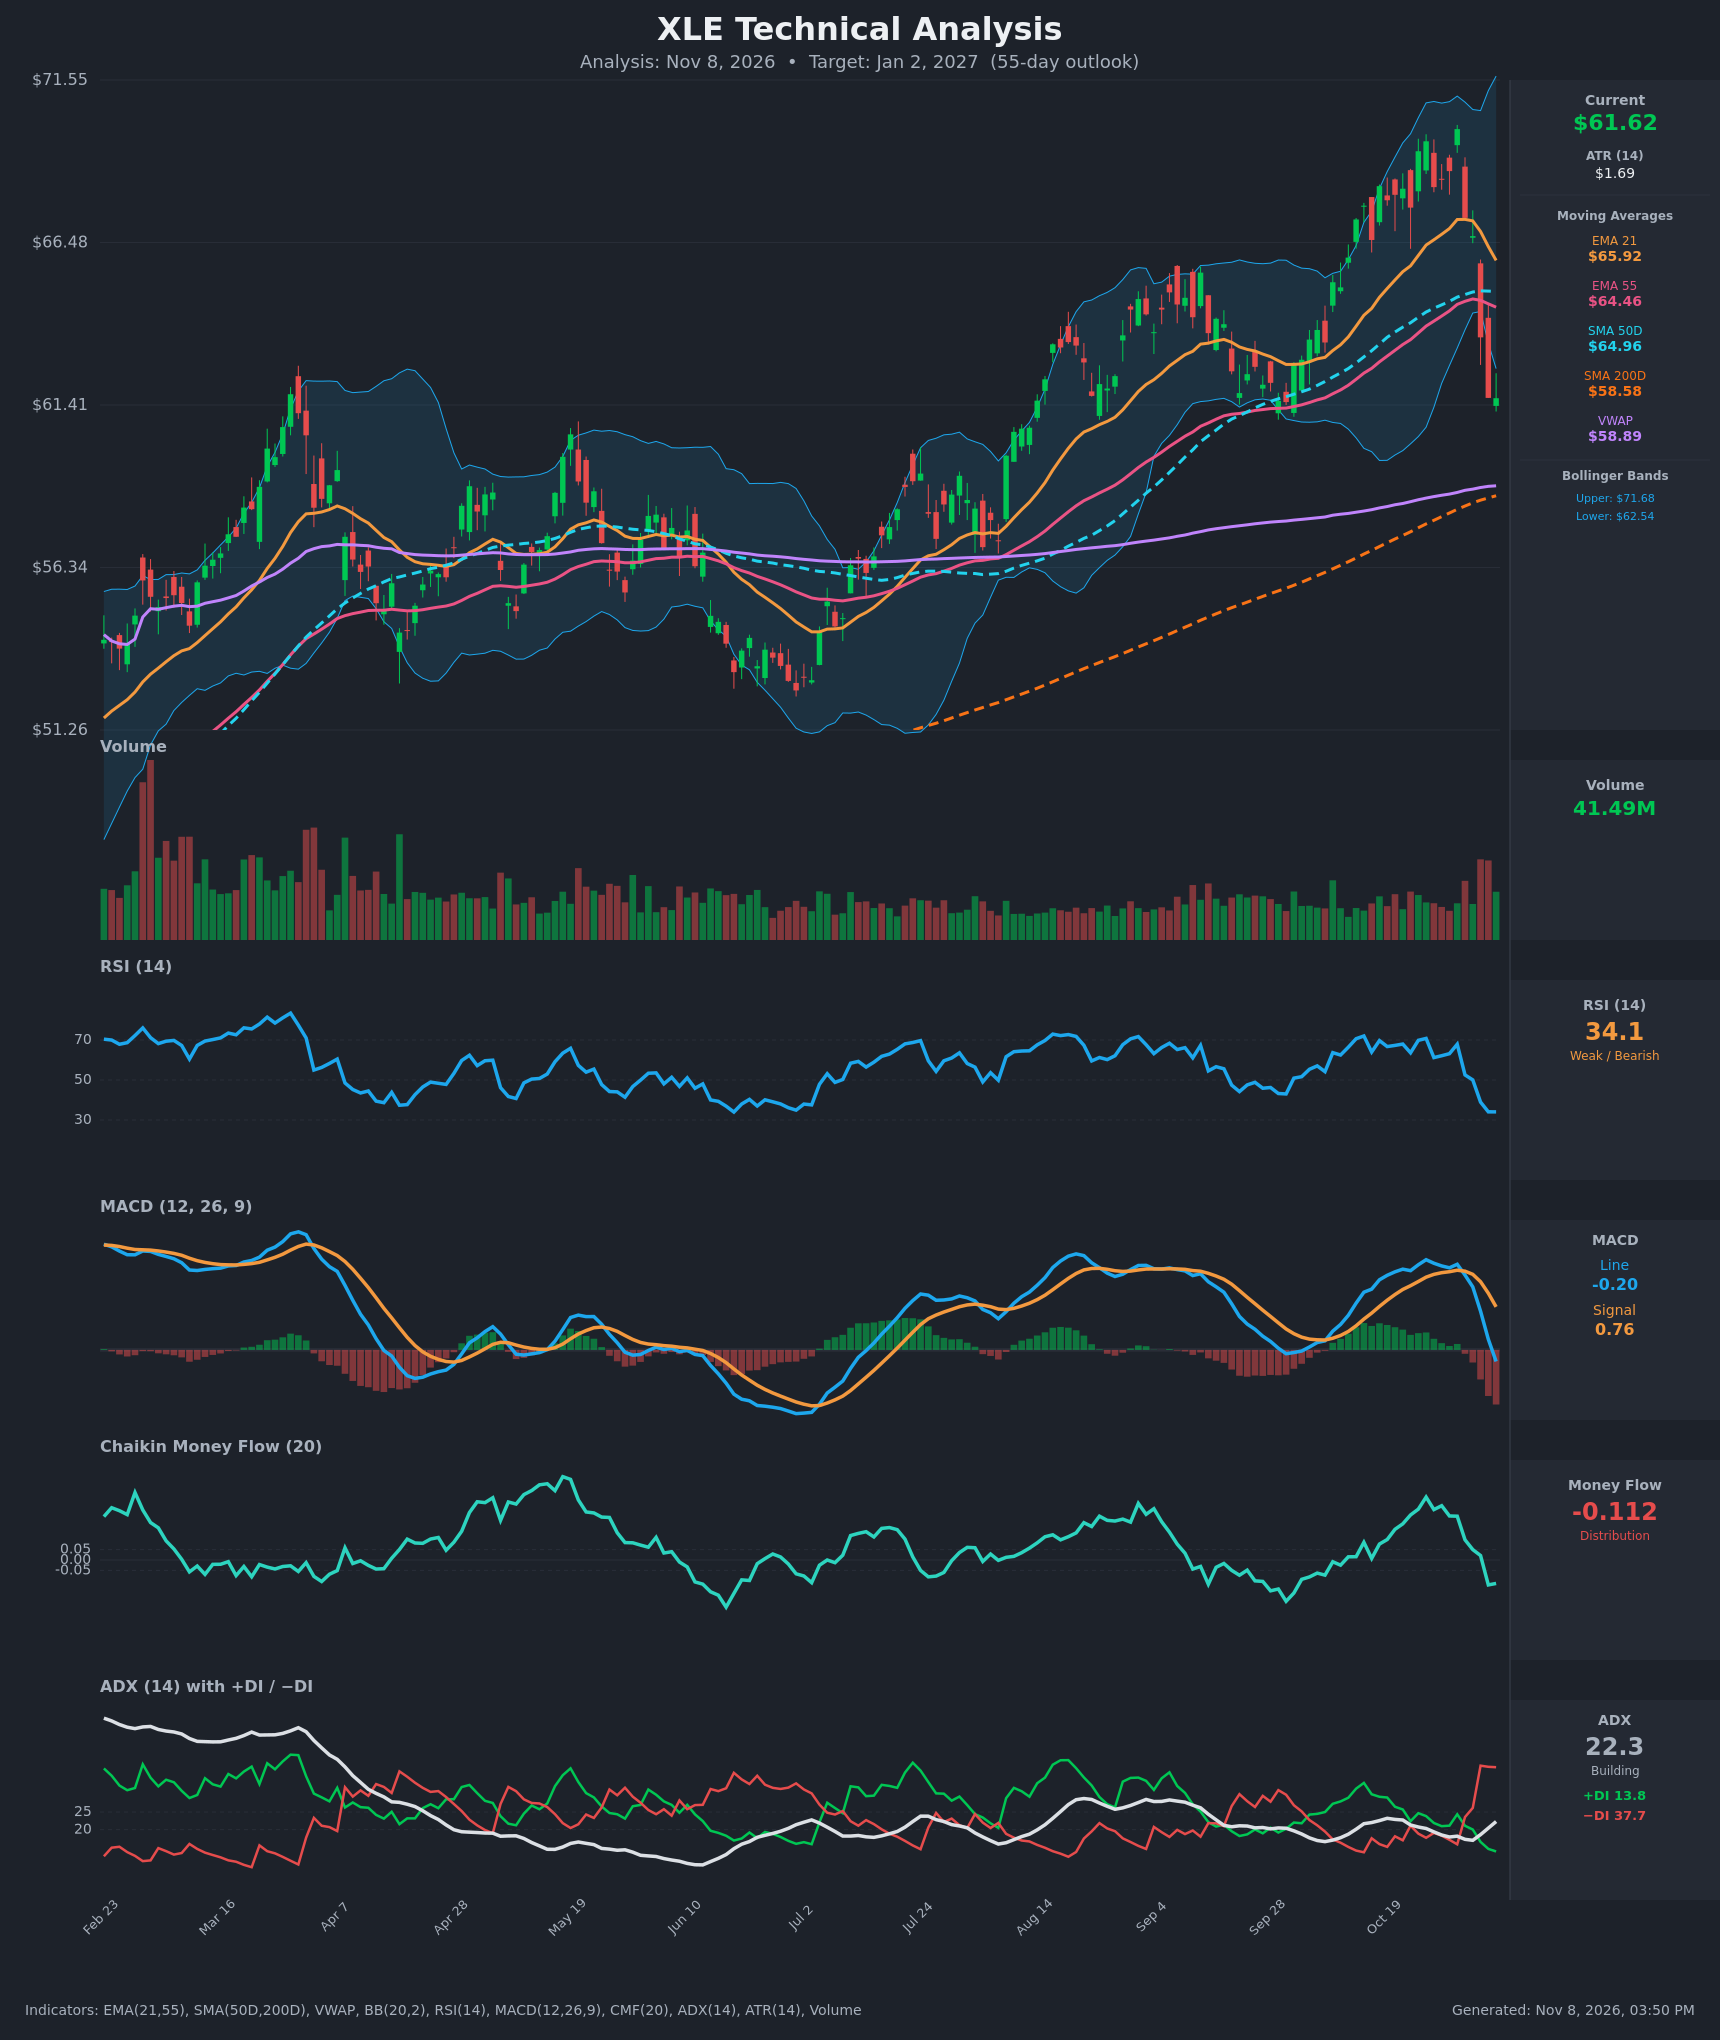
- RSI (14): 34.06, down sharply from 70.8 on Oct 26 and 67.9 on Oct 30. It is approaching oversold (<30) but has not reached it, and it shows no bullish turn yet. Momentum is clearly bearish, though a short-term bounce is possible. [Bearish]
- 20 EMA (EMA 21): $65.92, and falling after peaking near $67.20. Price at $61.62 is about 6.5% below it, so the EMA acts as overhead resistance. EMA 21 is also converging on EMA 55 ($64.46). The gap has narrowed from about 2.65 to 1.46, so a bearish EMA crossover is approaching. [Bearish]
- MACD: The line is -0.203 and the signal is 0.758, giving a histogram of about -0.96. The line crossed below the signal around Nov 2 and has now dropped below zero. The histogram is expanding negatively, which shows accelerating downside momentum. [Bearish]
- Bollinger Bands (20): Upper $71.68, lower $62.54. Price at $61.62 sits below the lower band after a sharp breakdown from near the upper band. A close below the lower band signals strong downside momentum and a stretched, oversold short-term condition. In a developing downtrend, band-walking can continue, but mean-reversion bounces toward the midline (~$67) are common. [Bearish]
- CMF (20): -0.112, which is below the -0.05 threshold. It has flipped from +0.30 on Oct 26 to distribution within about 8 sessions. This confirms heavy selling pressure. [Distribution]
- ADX (14): 22.3 and rising from 17.0, so a trend is building but is not yet strong (>25). −DI (37.7) is far above +DI (13.8), and −DI crossed above +DI around Nov 2. Bears are firmly in control. [Weak-to-Developing Trend, Bearish]
- Volume: 41.49M. Volume rose on the recent red candles (Nov 4–5), which is above the quiet levels of the prior two months. The elevated volume confirms the breakdown rather than a low-conviction dip. [Bearish – distribution/selling volume]
DIVERGENCES & TRENDS
- There is no bullish RSI or MACD divergence. Both indicators fell together with price, so the move is confirmed.
- Price made a higher high near $70.02 on Oct 30 while RSI (67.9) stayed below its Oct 26 peak (70.8) and CMF was lower. This is a mild bearish divergence that preceded the drop.
- MACD: A bearish signal-line cross (~Nov 2) was followed by a zero-line break on Nov 6.
- DI: The −DI/+DI bearish crossover happened around Nov 2, and ADX is rising behind it.
- Moving averages: Price lost EMA 21, EMA 55, SMA 50D ($64.96) and VWAP-adjacent momentum in one sharp 4-session leg (from $67.25 to $61.62). The SMA 50D / SMA 200D golden cross remains intact, and price is still above SMA 200D ($58.58) and VWAP ($58.89). The long-term uptrend is damaged but not broken.
- Trend: The Jul–Oct uptrend has been broken at the short-term level. The 5-session decline of about 12% from the high is steep, so some mean-reversion risk exists.
CHART PATTERNS
- Bearish Double Top / failed breakout: Highs near $69.64 (Oct 26) and $70.02 (Oct 30) were rejected near the upper Bollinger Band. The neckline near $66.7–67 broke on Nov 4 on heavy volume. The measured move (about $3.3 below the neckline) reaches roughly $63.4, which has already been met. The extended target is the prior consolidation base around $58.5–$61.
- Bearish Rising Wedge / Expanding structure (loose): The Jul–Oct advance had widening swings and a steep final leg. The sharp breakdown through the lower channel resembles a reversal.
- Support structure: The area around $58.6–$59 combines SMA 200D and VWAP, and it is the logical magnet for continued downside. A late-Sept swing low near $60.5–$61 is the first minor support.
POTENTIAL SCENARIOS
- Scenario 1: Bearish Continuation to the SMA 200D / VWAP Zone — The breakdown extends as −DI dominance and ADX rising above 25 drive price toward long-term support. Trigger: a daily close below $60.50 (late-Sept swing low). Target: $58.50–$59.50, with a possible overshoot to $56.50. Invalidation: a daily close back above $64.50 (EMA 55 / SMA 50D cluster). (50% probability)
- Scenario 2: Bullish Oversold Bounce and Recovery — RSI nears 30, price is below the lower band, and a short-covering rally mean-reverts toward the EMA cluster. Trigger: a close above $63.50 (the Nov 4 gap area) with a bullish MACD histogram turn. Target: $64.50–$66.00 (EMA 55, SMA 50D, EMA 21). Invalidation: failure at $64.50 and a close below $60.00. (30% probability)
- Scenario 3: Neutral Range-Bound Base — Price consolidates above SMA 200D after the flush, with weak buying and weak selling. Trigger: holding $59–$63 for several weeks as ADX flattens below 25. Target: $60–$63. Invalidation: a break below $58.50 or above $65. (20% probability)
PRICE TARGETS
- Target Price: $59.50 (55-day target, around Jan 2, 2027)
- Expected Range: $56.00 to $66.00 (width $10.00 ≈ 16.2% of current price, in line with 30–60 day guidance)
- Key Levels: Support at $58.60 (SMA 200D / VWAP zone), Resistance at $64.46 (EMA 55, with SMA 50D at $64.96 just above)
OVERALL BIAS
OVERALL BIAS: BEARISH - Price broke below EMA 21, EMA 55 and SMA 50D, and sits under the lower Bollinger Band. MACD crossed bearish, −DI dominates +DI, and CMF shows distribution on heavy volume. The most likely path is a drift toward SMA 200D / VWAP support near $58.6–$59.5, although an oversold bounce is a real risk.
This is educational analysis and not financial advice.