BB 55-day bullish forecast — Nov 8, 2026
- Bias: Bullish
- Timeframe: 55 days (made Nov 8, 2026, target date Jan 1, 2027)
- Price at analysis: $8.74
- Price target: $9.15
- Expected range: $8.10 – $9.65
- Result: Pending — graded after the close on Jan 1, 2027
Get a free AI analysis of BB today
Analysis
TECHNICAL INDICATORS
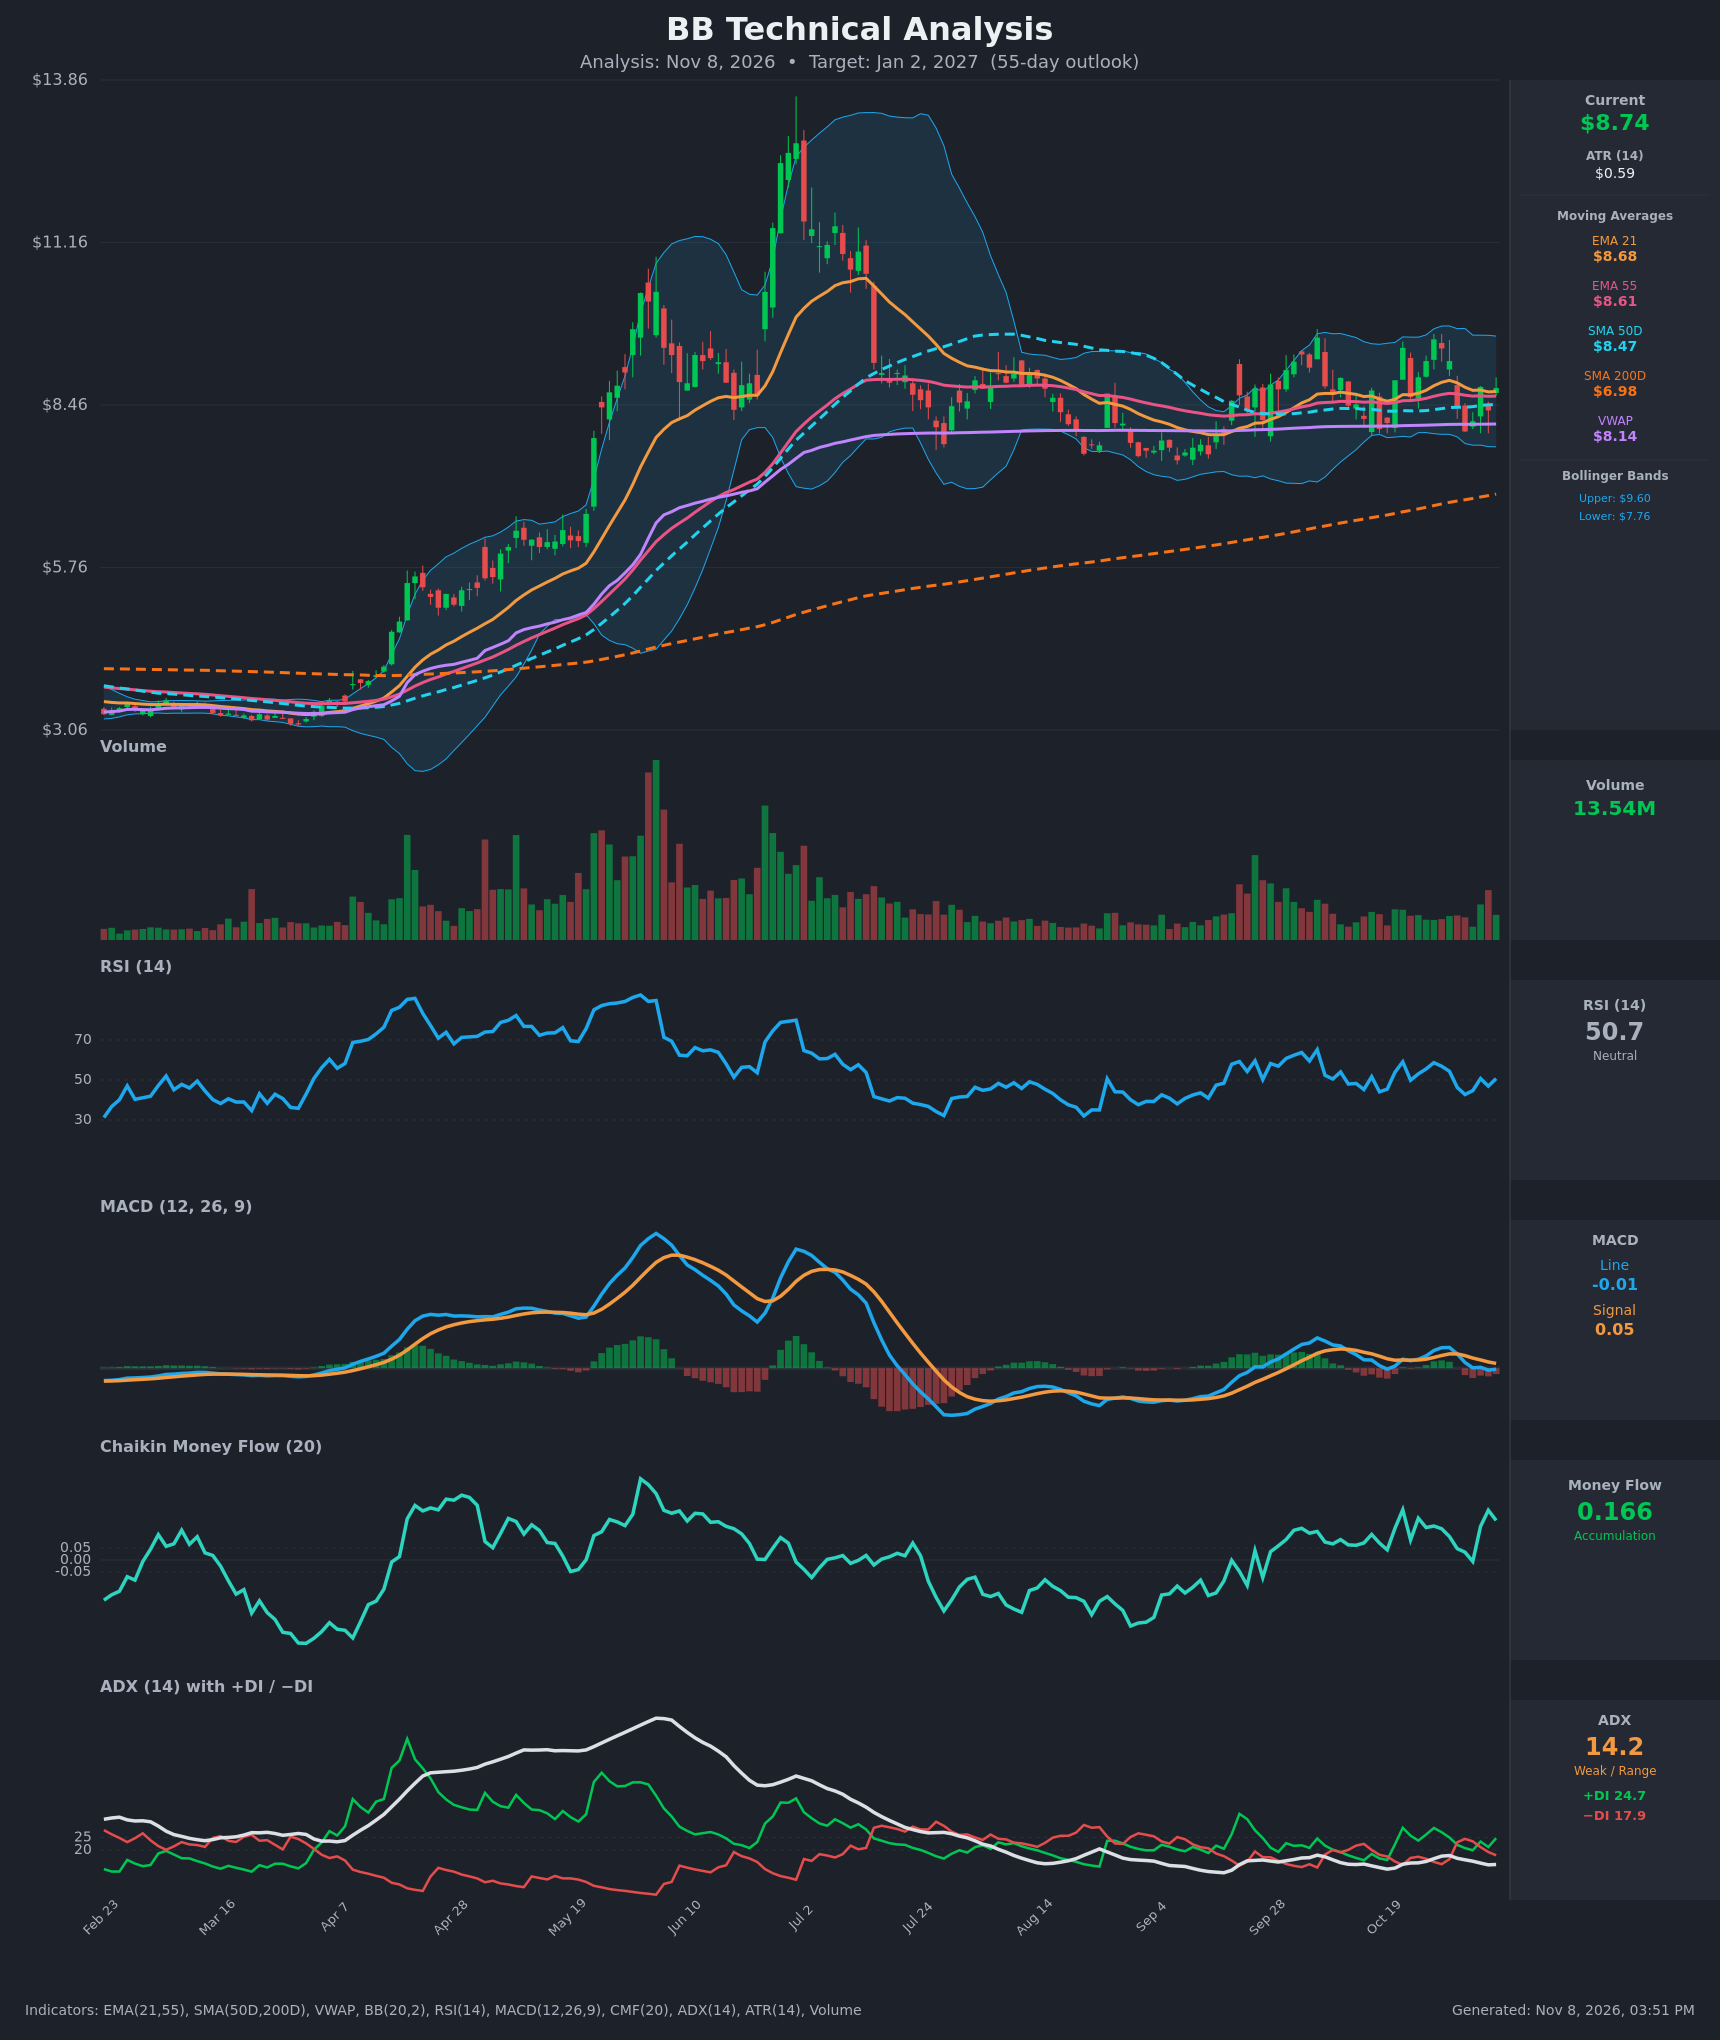
- RSI (14): 50.69, dead neutral. It has oscillated between about 43 and 59 for the past three weeks, with no overbought or oversold extremes and no clear momentum direction. [Neutral]
- 20 EMA (EMA 21): $8.68, with price at $8.74 just above it. EMA 21 is above EMA 55 ($8.61), so the short-term structure is mildly positive. Price has been hugging the average, so the support is only marginal. [Bullish]
- MACD: Line -0.010 is below Signal 0.046, with a slightly negative histogram. The bearish crossover occurred around Oct 30. The line is flat near zero, so momentum is fading rather than strongly bearish. [Bearish]
- Bollinger Bands (20): Upper $9.60, lower $7.76, midline about $8.68. Price sits at the midline (about 53% of the band width), so there is no squeeze or extension signal. Band width is moderate, and the $9.60 upper band lines up with recent swing highs. [Neutral]
- CMF (20): 0.166, well above +0.05, and positive for most of the last two months. Buying pressure persists even as price chops sideways. [Accumulation]
- ADX (14): 14.2, below 20, so the market is range-bound. +DI (24.7) is above −DI (17.9), which gives a mild bullish tilt, but there is no trend to speak of. [Weak Trend, mild bullish lean]
- Volume: 13.54M, with the latest bar green and above the muted average of the past few months. The volume spike of the past two weeks was not decisive in either direction. [Mild bullish interest, no confirmation]
DIVERGENCES & TRENDS
- Long-term trend: Price is well above SMA200D ($6.98), which is rising steadily. SMA50D ($8.47) is above SMA200D, so the golden cross is long established. The major trend is up.
- Moving-average stack: Price ($8.74) is above EMA21 ($8.68), EMA55 ($8.61), SMA50D ($8.47) and VWAP ($8.14). The stack is bullish but tightly bunched, which fits consolidation.
- Bullish divergence in flow: CMF has trended higher since August (from negative to +0.17) while price has only moved sideways. That is accumulation under the surface.
- Momentum: MACD crossed below its signal around Oct 30 and has not recovered. RSI has made lower highs since Oct 27 (58.7 → 50.7) while price holds its range. This is short-term momentum cooling, not a trend reversal.
- ADX/DI: ADX has fallen from about 17.8 to 14.2, and +DI/−DI flipped back and forth in late October. They have returned to bull control (+DI above −DI) in the last two bars.
- Range structure: Since the July peak, price has made a series of higher lows (about $7.4 in Aug → about $7.8–8.0 in Oct) against resistance at $9.4–9.8.
CHART PATTERNS
- Broad consolidation (rectangle) with an ascending-triangle bias: Price has been contained between roughly $7.80–8.00 support and $9.50–9.80 resistance, with higher lows building since August. This resembles the Ascending Triangle in the reference diagram, a bullish continuation pattern within the prior uptrend. A confirmed close above about $9.60 (with volume) would project a measured move of roughly the range height (~$1.7) to about $11.00+, though that is beyond the 55-day base case.
- Post-spike base: After the blow-off to about $13 and the subsequent decline, the stock has formed a multi-month base above the rising SMA200D. This is constructive, but it is not yet a breakout.
- No clear bearish reversal pattern: There is no head-and-shoulders or triple top in the current structure. Resistance at $9.4–9.8 has been tested but not repeatedly rejected in a clean top.
POTENTIAL SCENARIOS
- Scenario 1: Bullish Ascending-Triangle Breakout Attempt — Accumulation (CMF +0.17) and higher lows lead price to retest the top of the range and push through. Trigger: daily close above $9.00, then above the $9.55–9.60 resistance and upper Bollinger Band, with MACD re-crossing above its signal. Target: $9.15 base case by day 55, with an extension to $9.80–10.20 on a clean breakout. Invalidation: daily close below $8.14 (VWAP) and the rising SMA50D at $8.47. (45% probability)
- Scenario 2: Neutral Range-Bound Chop — With ADX at 14, price keeps oscillating around the 21/55 EMAs between about $8.00 and $9.50 without a resolution. Trigger: repeated rejections near $9.5 and bounces near $8.1–8.4. Target: $8.50–$9.00. Invalidation: close above $9.60 or below $7.76. (35% probability)
- Scenario 3: Bearish Range Breakdown — The MACD bearish crossover and fading RSI extend, and price loses the EMA/SMA50D cluster and the range floor. Trigger: close below $8.14 and then the lower Bollinger Band at $7.76. Target: $7.40–7.76, with a deeper test toward $7.00 (SMA200D area). Invalidation: reclaim of $8.70 with MACD turning up. (20% probability)
PRICE TARGETS
- Target Price: $9.15 (55-day, about +4.7% from $8.74)
- Expected Range: $8.10 to $9.65. Width is $1.55, or about 17.7% of the current price, which fits the 30–60 day guidance of 12–18%.
- Key Levels: Support at $8.14 (VWAP, with the SMA50D at $8.47 as the first cushion). Resistance at $9.55 (recent swing high and upper Bollinger Band area).
OVERALL BIAS
OVERALL BIAS: BULLISH - Price is above every major moving average and the rising SMA200D, CMF shows persistent accumulation (+0.166), +DI leads −DI, and higher lows are building under $9.5 resistance. The tilt is modest, because ADX is weak and MACD is slightly below its signal, so the move may be gradual and range-bound along the way.
This is educational analysis and not financial advice.