BAC 55-day bearish forecast — Nov 8, 2026
- Bias: Bearish
- Timeframe: 55 days (made Nov 8, 2026, target date Jan 1, 2027)
- Price at analysis: $49.42
- Price target: $47.60
- Expected range: $44.20 – $52.30
- Result: Pending — graded after the close on Jan 1, 2027
Get a free AI analysis of BAC today
Analysis
TECHNICAL INDICATORS
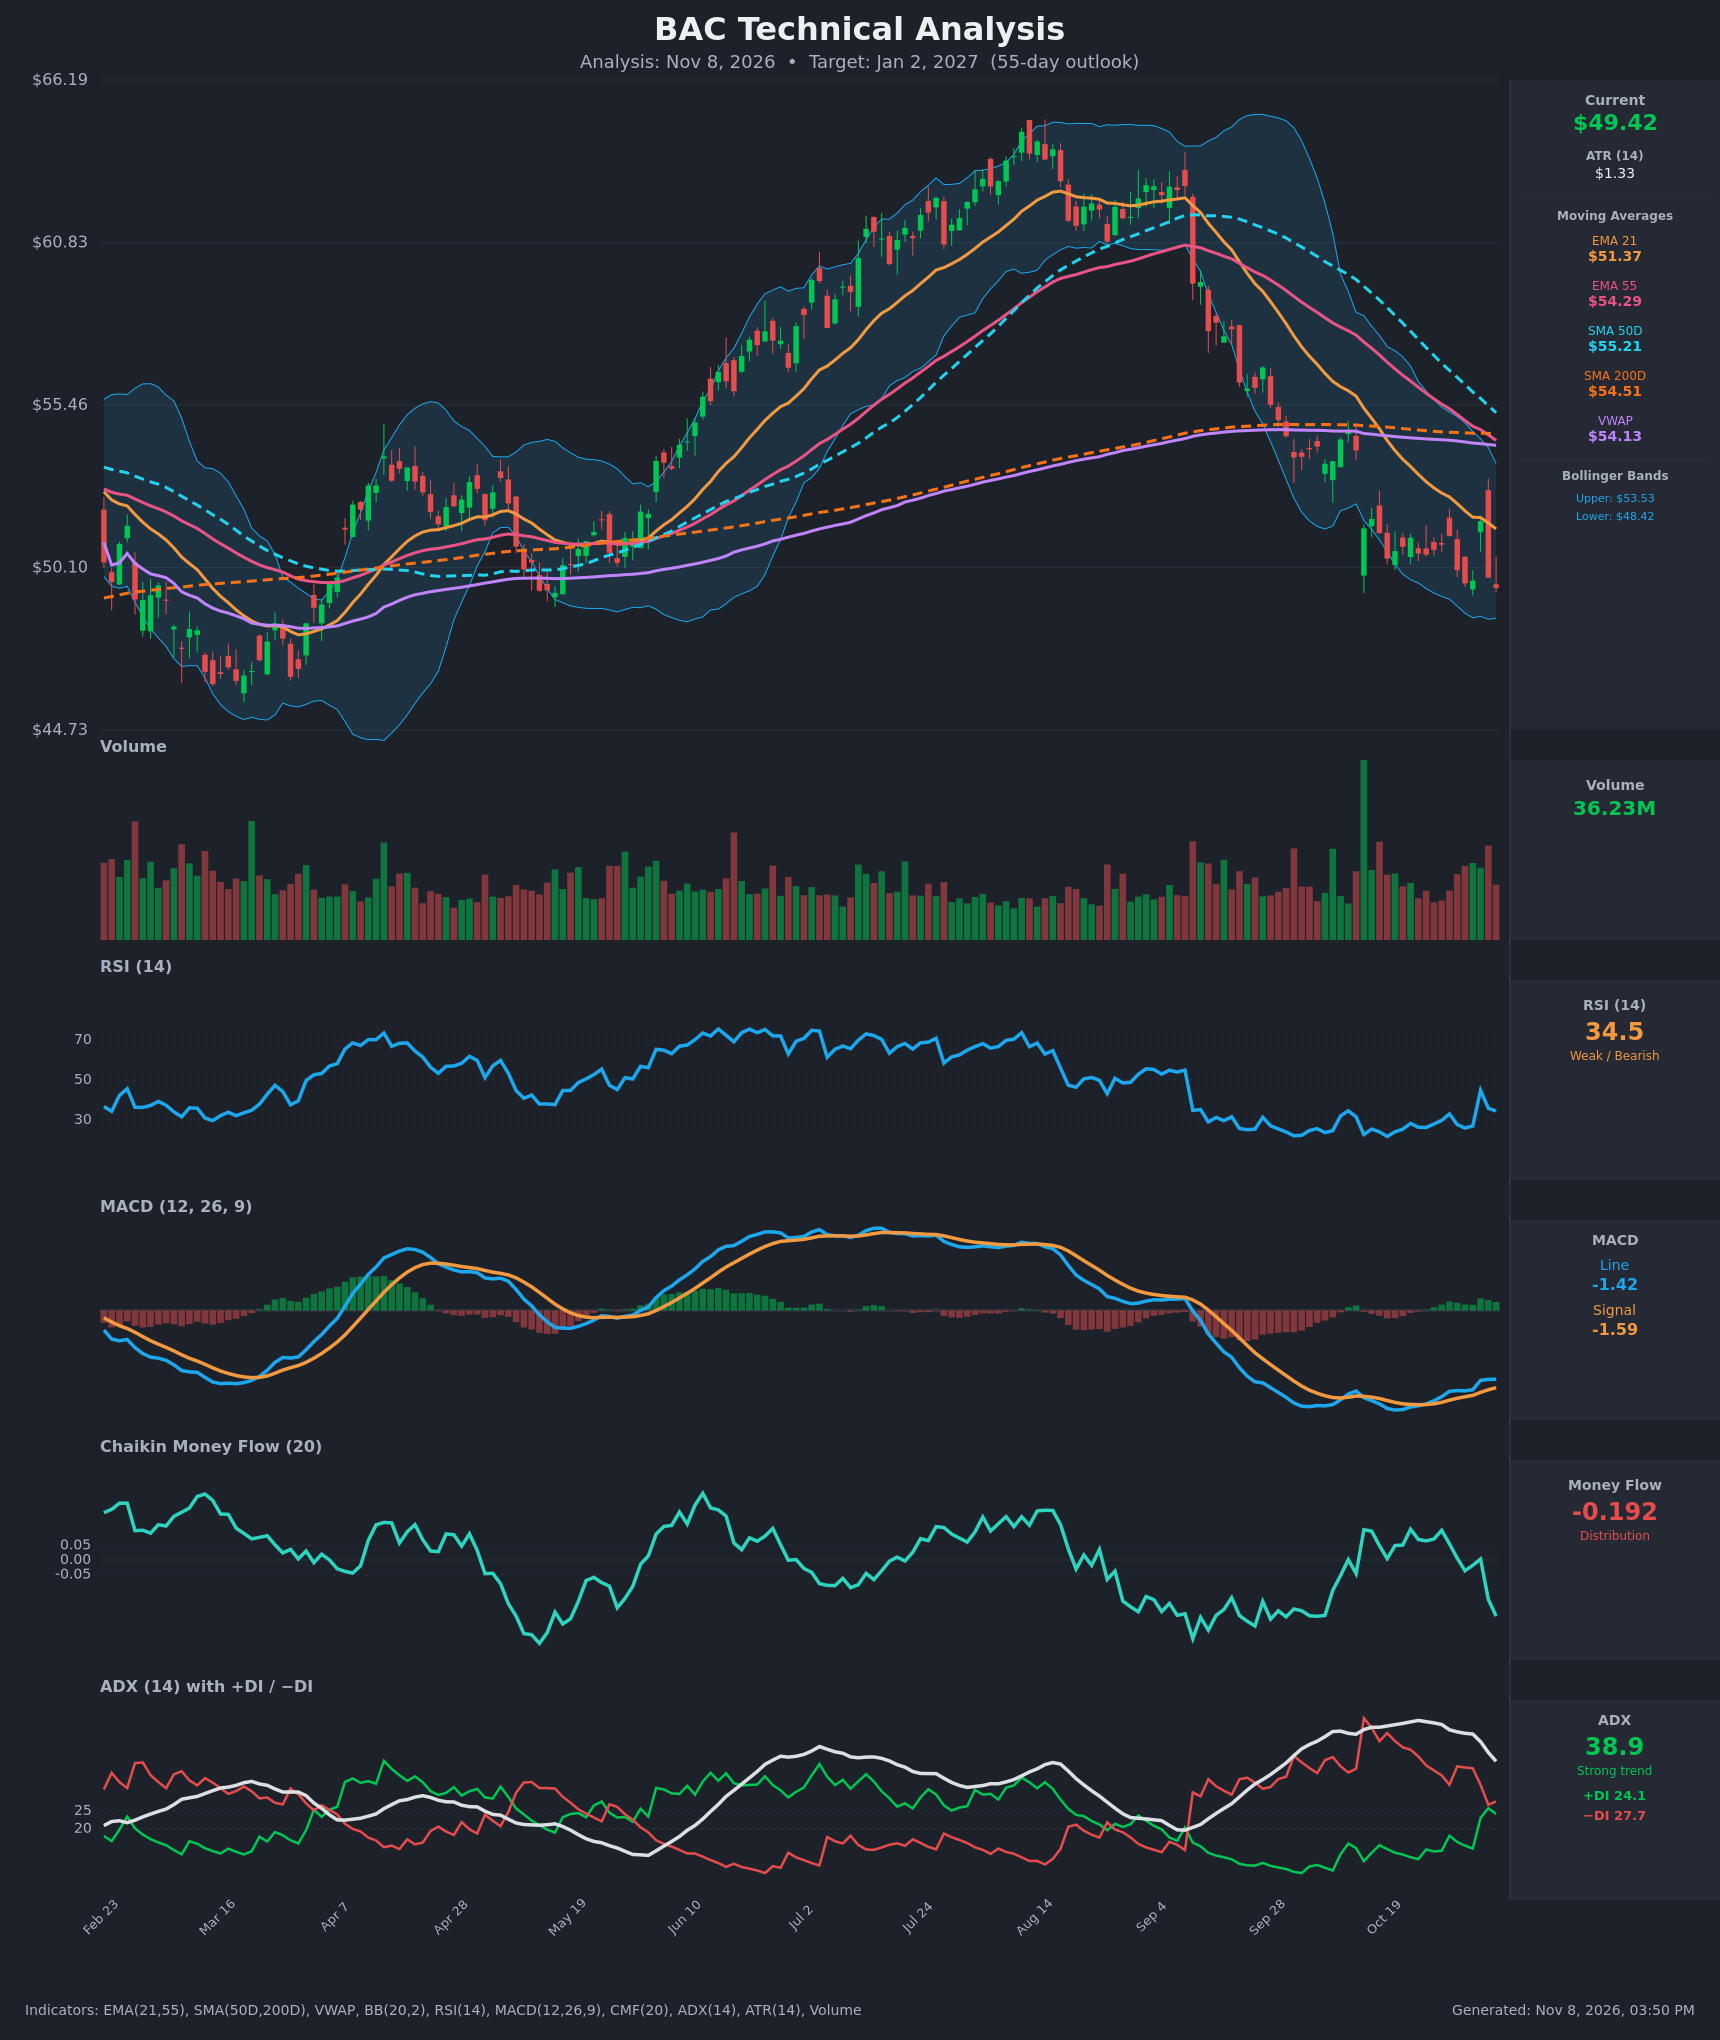
- RSI (14): 34.5. It has recovered from an extreme 21.8 on Oct 19 but is still below 40 and was rejected after the Nov 4 spike (44.8 → 34.5). The pattern of higher RSI lows against lower price lows is a mild bullish divergence, but the RSI has not moved back above 50. [Bearish]
- 20 EMA: The 21 EMA is at $51.37 and price ($49.42) is below it, so it acts as resistance. The Nov 4 bounce to $51.63 stalled right at the EMA and fell back. The EMA21 is also well below the EMA55 ($54.29), a bearish stack. [Bearish]
- MACD: Line -1.415 is above signal -1.589, with a small positive histogram. The line crossed above the signal around Oct 26 and the lines are still rising, but both remain deeply negative. This is a weak relief signal inside a downtrend, not a trend reversal. [Neutral]
- Bollinger Bands (20): Upper $53.53, lower $48.42, with price at $49.42 in the lower quarter of the bands. The bands are narrowing after the September-October expansion. Price has been walking the lower half of the bands, which shows persistent selling pressure. A bounce toward the $51 midline is possible, but there is no squeeze breakout. [Bearish]
- CMF (20): -0.192, a sharp fall from roughly +0.0 to +0.1 in late October. It is well below the -0.05 threshold, so the latest rebound attempt was met with selling and heavier distribution. [Distribution]
- ADX (14): 38.9 and falling from a peak near 50, with −DI (27.7) still above +DI (24.1). The trend is strong but maturing. The DI lines are converging (+DI rose from 11 to 24), so bearish control is fading, though no bullish crossover has occurred. [Strong Trend, Bearish, weakening]
- Volume: 36.23M, elevated versus the typical level in the volume pane. Selling candles carried high volume in Nov, and the Nov 4 spike was sold into on heavy volume. That points to supply at $51.5 and no clear capitulation or accumulation. [Bearish interpretation]
DIVERGENCES & TRENDS
- Bullish divergence (momentum): Price is below its Oct 19 level ($50.39), while RSI (34.5 vs 21.8) and MACD (-1.42 vs -2.02) have higher lows. This suggests selling momentum is fading and supports a relief bounce.
- Bearish confirmation (money flow): CMF has dropped to -0.19, which does not support a durable bounce.
- Moving averages: Price is below the EMA21, EMA55, SMA50D ($55.21), SMA200D ($54.51) and VWAP ($54.13), all of which are declining or flat. The SMA50D is falling toward the SMA200D, and a death cross is likely in the coming weeks (gap about $0.70 and closing about $0.23 per day).
- Crossovers: The MACD bullish crossover (Oct 26) has had no price follow-through. Since Oct 19, price has gone nowhere ($49.4 to $51.6), so momentum improved without price improving.
- Overall: The trend is down, but its energy is waning as ADX falls and the DIs converge. Conflicting signals are weighted toward the trend and distribution.
CHART PATTERNS
- Bearish Flag/Rectangle (continuation): After the sharp September-October decline from about $61 to $50, price has consolidated between roughly $49.4 and $51.6 beneath falling moving averages. This resembles the Bearish Flag/Pennant in the reference diagram. A breakdown below $48.4 would project toward the mid-$40s. The full measured move (about $11) would reach the high $30s, which is unlikely within 55 days, so a partial target in the $46-47 area is more realistic.
- Potential double bottom (reversal): The lows near $49.4-49.6 (Nov 2 and Nov 6) form a possible Bullish Double Bottom, but it is unconfirmed. It needs a close above the Nov 4 high (~$51.6) and then the $53.5 band. Until then it is only a risk to the bearish view.
- Long-term context: The Mar-Apr lows near $46-47 and the range top near $62 are the larger structure. A death cross would add a major bearish signal.
POTENTIAL SCENARIOS
- Scenario 1: Bearish Flag Breakdown — The consolidation resolves lower as distribution continues and the EMA21 keeps capping rallies. Trigger: daily close below $48.40 (lower Bollinger Band) with CMF staying negative and a death cross forming. Target: $46.00-$47.50, with an extension to about $44.50. Invalidation: daily close above $51.60 (EMA21 and Nov 4 high). (50% probability)
- Scenario 2: Bullish Relief Rally / Double Bottom — The momentum divergences play out and price mean-reverts toward the moving-average cluster. Trigger: close above $51.60 with MACD histogram expanding and CMF back above 0. Target: $53.50-$54.50 (upper band, SMA200D and VWAP). Invalidation: close below $48.40. (32% probability)
- Scenario 3: Neutral Range Grind — Price stays between $48.4 and $51.6 as ADX fades below 25. Trigger: continued overlap of candles and no close outside the range. Target: $49.50-$51.00. Invalidation: a decisive close outside $48.40-$51.60. (18% probability)
PRICE TARGETS
- Target Price: $47.60 (55 days, about -3.7% from $49.42)
- Expected Range: $44.20 to $52.30 (width $8.10, about 16.4% of current price, consistent with the 30-60 day guidance)
- Key Levels: Support at $48.42 (lower Bollinger Band; below that, $46.50 from the spring lows), Resistance at $51.37 (EMA21; above that, $51.63 Nov 4 high and $54.29 EMA55)
OVERALL BIAS
OVERALL BIAS: BEARISH - Price is below every major moving average, −DI still leads, CMF shows heavy distribution (-0.19), and the Nov 4 bounce failed at the EMA21 on volume. The RSI/MACD bullish divergence and the proximity to the lower Bollinger Band keep conviction modest and a relief bounce toward $51-$52 likely along the way.
This is educational analysis and not financial advice.