IWM 55-day bearish forecast — Nov 8, 2026
- Bias: Bearish
- Timeframe: 55 days (made Nov 8, 2026, target date Jan 1, 2027)
- Price at analysis: $273.67
- Price target: $265.00
- Expected range: $248.00 – $288.00
- Result: Pending — graded after the close on Jan 1, 2027
Get a free AI analysis of IWM today
Analysis
TECHNICAL INDICATORS
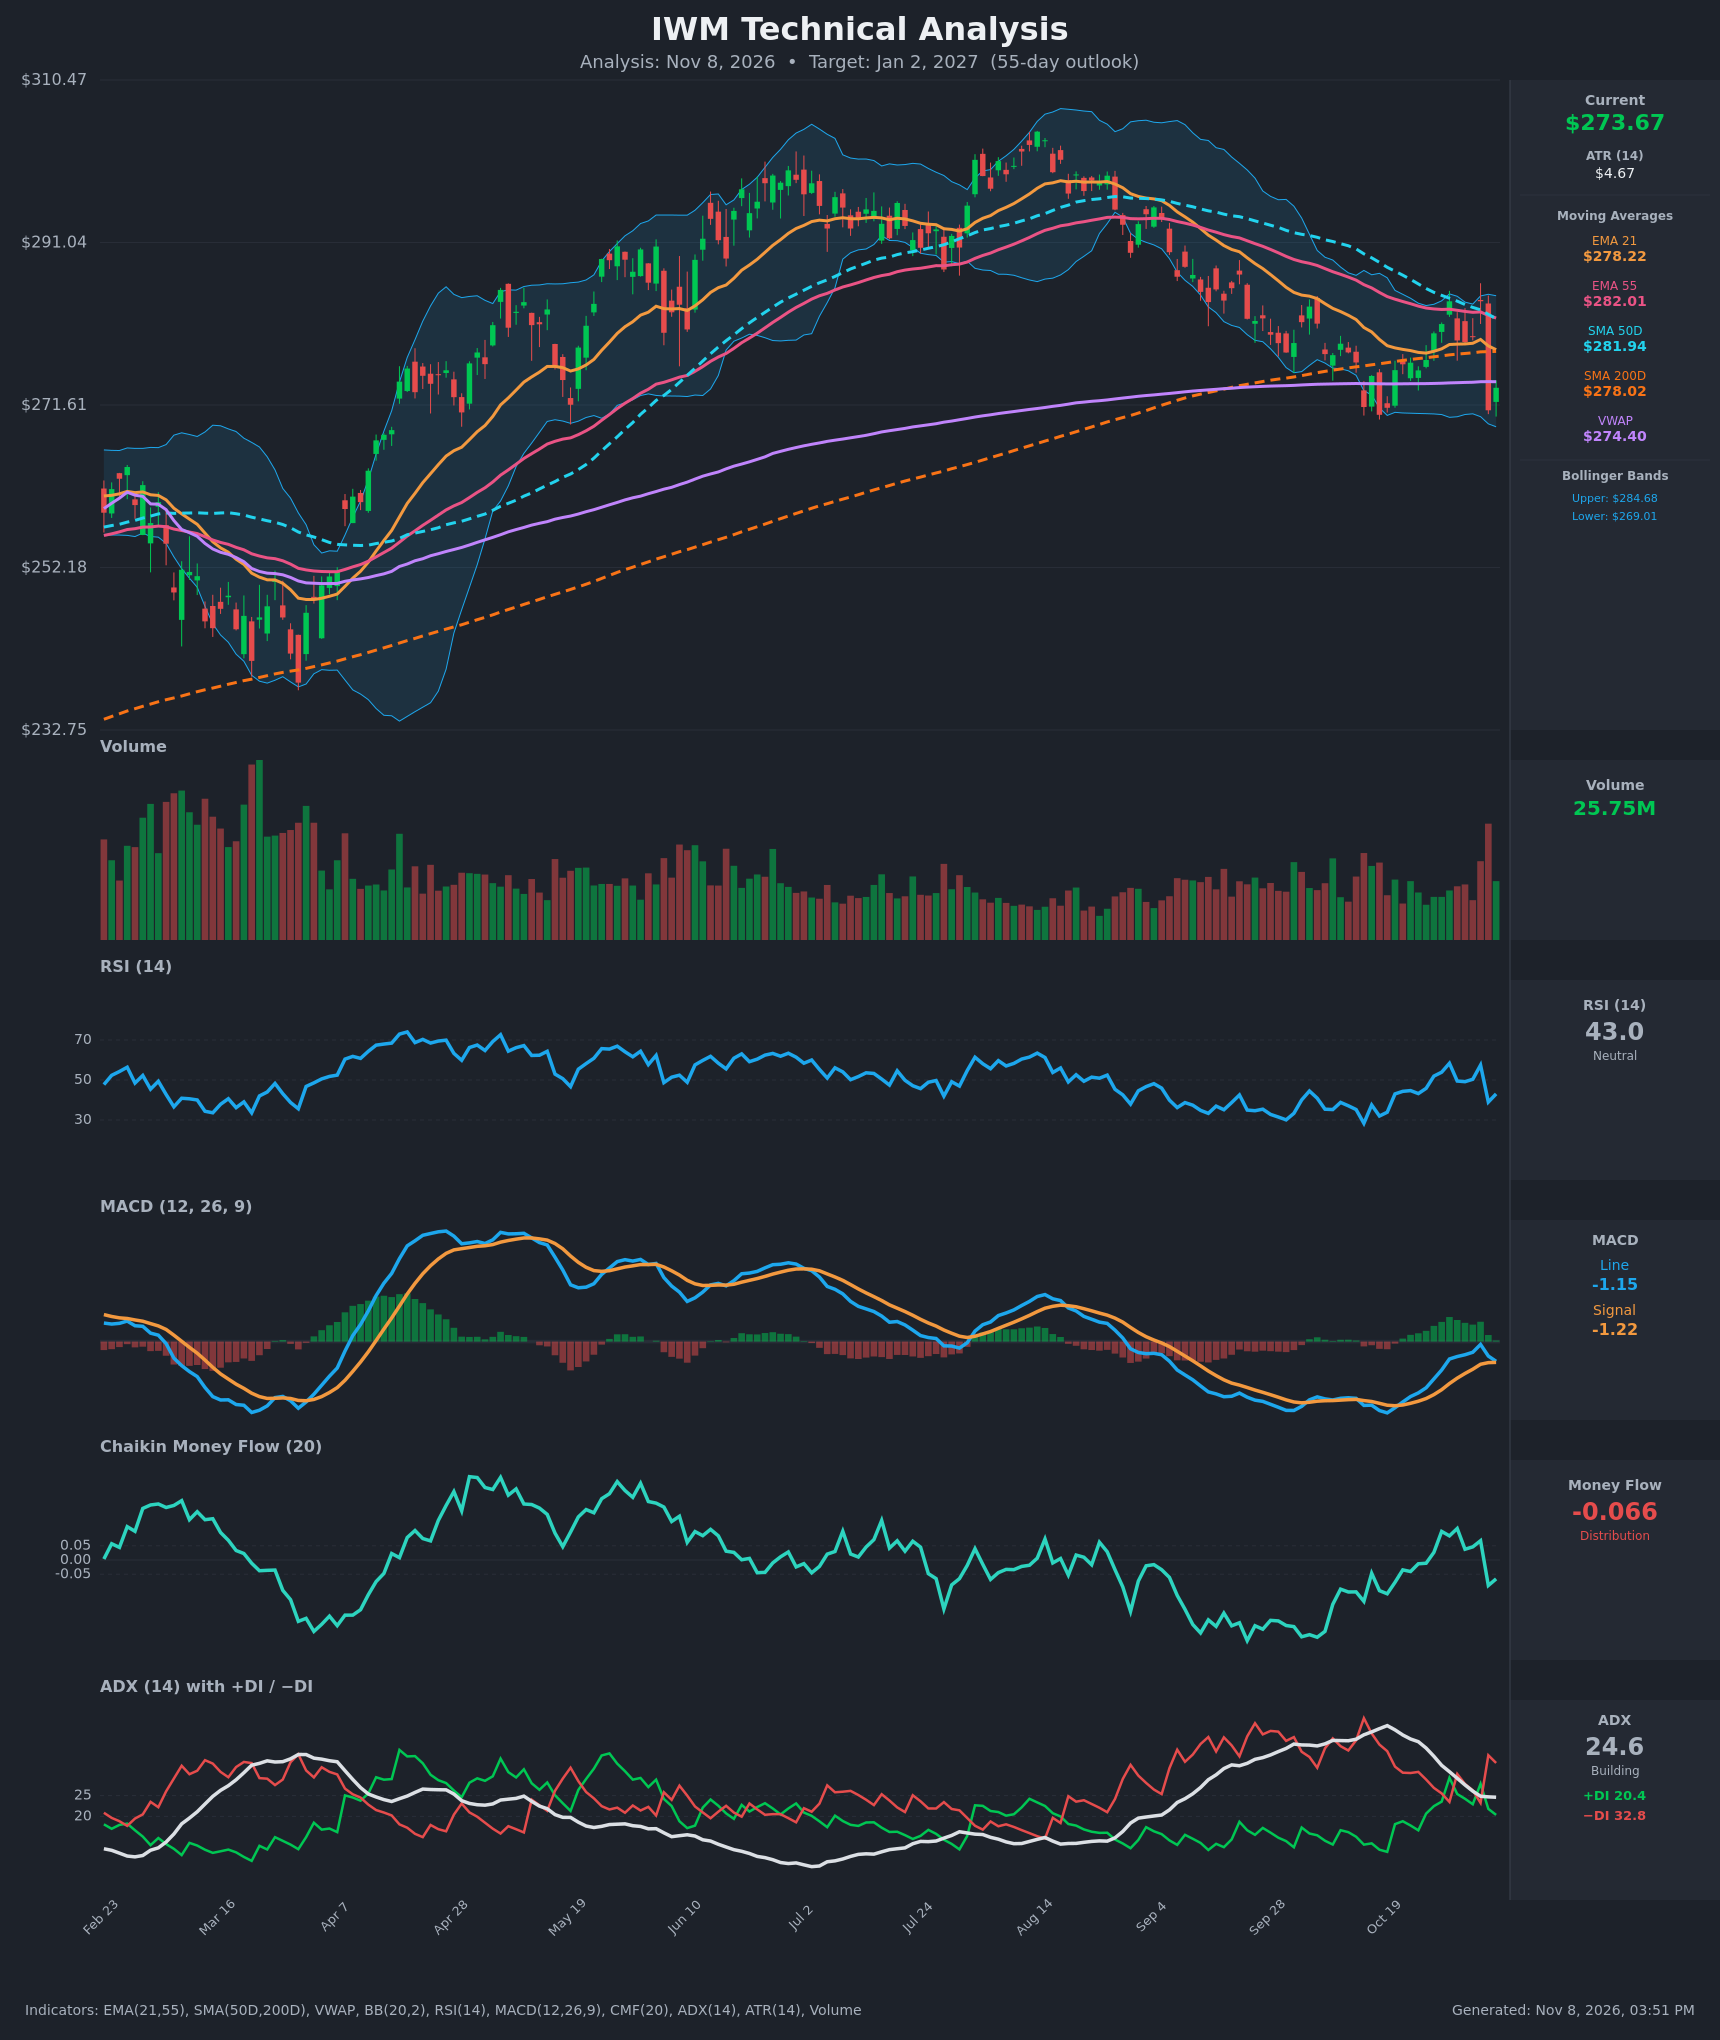
- RSI (14): 43.05, below the 50 midline and not oversold. It dropped from 57.5 to 39.0 on Nov 5 and only partly recovered. The lower-high structure in RSI since the Oct 29 peak at 58.4 favors sellers. [Bearish]
- 20 EMA (21 EMA): $278.22. Price at $273.67 is about 1.6% below it, so it is now overhead resistance. Price lost it on the Nov 5 reversal after briefly holding above. EMA21 is also below EMA55 ($282.01), a bearish stack. [Bearish]
- MACD: Line -1.155, signal -1.216, histogram about +0.06. Both lines are below zero. The histogram has collapsed from +1.16 on Nov 4 and is about to flip negative. The recent bullish crossover is failing and is likely to roll over. [Bearish]
- Bollinger Bands (20): Upper $284.68, lower $269.01, midline about $276.85. Price is in the lower half, about $4.65 above the lower band, after a rejection near the upper band on Nov 4 ($284.02). The bands are moderately narrow, and price is below the midline. [Bearish]
- CMF (20): -0.066, below the -0.05 threshold. It fell from +0.068 to -0.089 in one session, so the Nov 5 reversal was accompanied by distribution. [Distribution]
- ADX (14): 24.6 and declining from a 41.7 peak, so the earlier downtrend has matured and is now near the trend threshold. −DI (32.8) is well above +DI (20.4), and the sellers regained control with the Nov 5 DI flip. [Moderate Trend, Bearish Direction]
- Volume: 25.75M. The Nov 5 selloff of about -4.6% came on a clear volume spike, a high-volume rejection from resistance. The Nov 6 bounce is on lighter volume. [Bearish – heavy-volume selling, weak-volume bounce]
DIVERGENCES & TRENDS
- Moving averages: Price sits below EMA21, EMA55, SMA50D ($281.94) and SMA200D ($278.02). The SMA50D is now converging with the EMA55 and heading toward the SMA200D, with the gap down to about $3.9. A death cross is a real possibility within the 55-day window.
- Trend structure: Since the August peak near $300, price has made a series of lower highs (about $286, then $284). That is a downtrend with only a counter-trend rally.
- MACD: It crossed above its signal line on Nov 3-4 from deep negative territory. The histogram has since faded from +1.16 to +0.06, which is a failing bullish crossover.
- RSI/CMF: Both rolled over from their recent highs in lockstep with price. There is no bullish divergence yet. RSI never reached oversold on the recent low, so there is no strong washout.
- Support test: The $269-$271 zone has been tested twice (Oct 19 and Nov 5) and held. This is the main bullish counterpoint, but the bounces keep failing at lower highs.
- VWAP: Price is slightly below VWAP ($274.40), so there is no buyer support there.
CHART PATTERNS
- Descending triangle / lower highs into flat support: Lower highs from the Aug top meet a flat floor at $269-$271. This is the dominant read. A break below the floor projects a move of roughly the pattern height ($284 − $270 ≈ $14) to about $256.
- Bearish rejection at the SMA50/EMA55 cluster: The failed rally to $284 followed by the heavy-volume reversal looks like a bull trap.
- Possible Bullish Double Bottom (counter-case): The two lows at about $270-$271 form a double bottom, but confirmation needs a close above about $284.7 (the swing high and upper Bollinger Band). That is not close, and the pattern is currently losing to the lower highs.
- Bearish Rising Wedge / Head and Shoulders: Neither is clearly present.
POTENTIAL SCENARIOS
- Scenario 1: Bearish Support Breakdown — Sellers keep control, price fails at the $278 EMA21/SMA200 zone, and then breaks the $269-$271 double-low support. A death cross of the 50D/200D adds pressure. Trigger: Daily close below $269.00 on rising volume. Target: $258-$262, with an extension toward $252. Invalidation: Daily close above $282 (EMA55/SMA50D). (50% probability)
- Scenario 2: Bullish Double-Bottom Recovery — The $269-$271 floor holds again, price reclaims the 21 EMA and SMA200, and a rally to the upper band follows. Trigger: Close above $278.50, then above $284.70. Target: $286-$292. Invalidation: Close below $269.00. (35% probability)
- Scenario 3: Neutral Range Chop — Price oscillates between $269 and $282 as ADX fades below 20. Trigger: Repeated failures at both extremes with falling volume. Target: $270-$280. Invalidation: Decisive close outside the $269-$282 range. (15% probability)
PRICE TARGETS
Timeframe: 55 days (to about Jan 2, 2027). Self-check: range width is $288.00 − $248.00 = $40.00, which is about 14.6% of $273.67 and within the 12-18% guidance for 30-60 days.
- Target Price: $265.00 (about 3.2% below current)
- Expected Range: $248.00 to $288.00
- Key Levels: Support at $269.00, Resistance at $278.20
OVERALL BIAS
OVERALL BIAS: BEARISH - Price is below all key moving averages, −DI dominates +DI, CMF shows distribution, and the heavy-volume Nov 5 reversal from the $284 resistance leaves the MACD bullish crossover fading. The $269-$271 double-low is the key level, and a break would open the move toward the high-$250s.
This is educational analysis and not financial advice.