KWEB 55-day bullish forecast — Nov 8, 2026
- Bias: Bullish
- Timeframe: 55 days (made Nov 8, 2026, target date Jan 1, 2027)
- Price at analysis: $24.88
- Price target: $25.90
- Expected range: $23.20 – $27.00
- Result: Pending — graded after the close on Jan 1, 2027
Get a free AI analysis of KWEB today
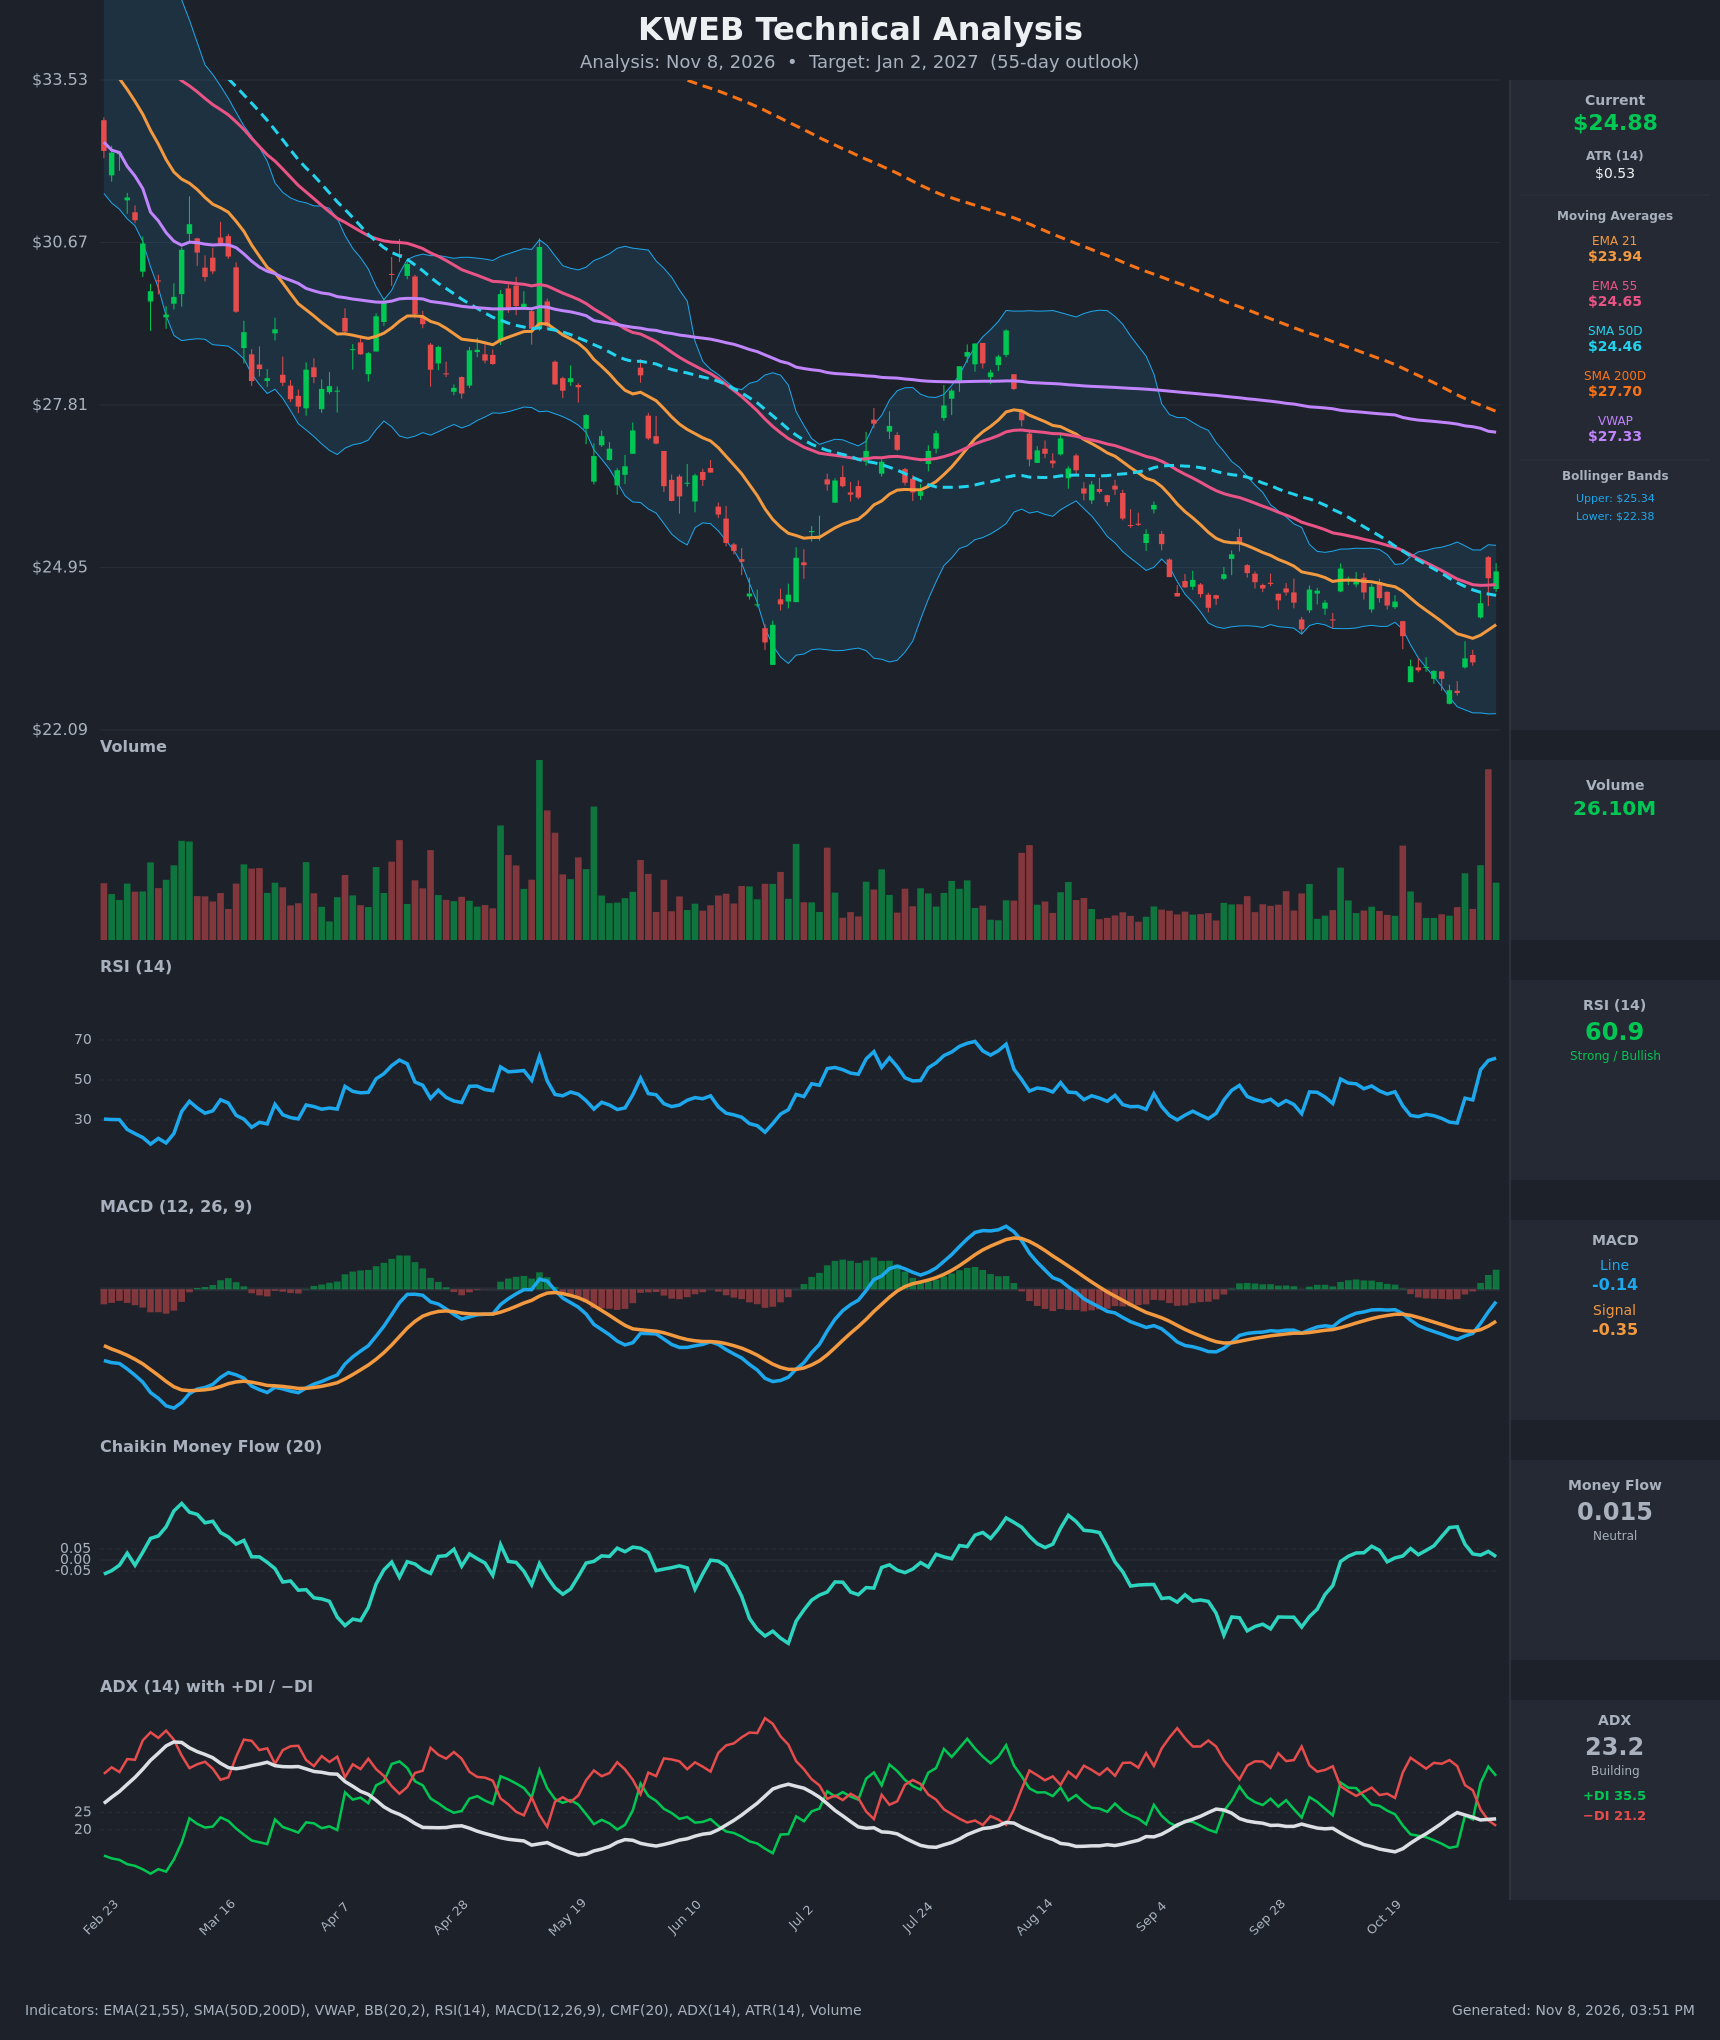
Analysis
TECHNICAL INDICATORS
- RSI (14): 60.93, up sharply from 28.5 on Oct 30 and 40 on Nov 3. Momentum has swung from oversold to firmly bullish in about a week. It is not yet overbought (<70), so there is room to run. [Bullish]
- 20 EMA (EMA 21 = $23.94): Price at $24.88 sits about 3.9% above the rising EMA21, which now acts as first support. EMA21 is still below EMA55 ($24.65), but the gap has narrowed from about $1.50 to about $0.70. A bullish EMA cross is possible if the rally holds. [Bullish]
- MACD: Line -0.136, signal -0.351, histogram +0.215 and expanding. The line crossed above the signal on Nov 4. Both are still below zero, so this is an early-stage recovery rather than a confirmed trend change. [Bullish]
- Bollinger Bands (20): Upper $25.34, lower $22.38, midline about $23.86. Price is at roughly 84% of the band range, just below the upper band. The bands were squeezed in October and are now expanding upward after the bounce off the lower band. There is short-term overextension risk, but price walking up the band is a strength signal. [Bullish]
- CMF (20): 0.015, inside the ±0.05 neutral zone and down from 0.151 on Oct 30. The rally has not been matched by clear accumulation, which is a caution flag. [Neutral]
- ADX (14): 23.2, in the "building" zone below 25 (it peaked at 25.0 on Oct 30 during the downtrend). +DI (35.5) is well above −DI (21.2), and the bullish DI crossover happened on Nov 4. Trend strength is modest but now favors the bulls. [Weak/Building Trend, Bullish]
- Volume: 26.10M on the latest bar, among the highest of the year. The spike near the bottom and the recent green bars suggest capitulation followed by buying interest. Follow-through volume is needed to confirm. [Bullish, needs confirmation]
Other moving averages:
- SMA50D: $24.46, now reclaimed and acting as support.
- SMA200D: $27.70, far overhead and still falling.
- VWAP: $27.33, overhead.
- Death cross: SMA50D is below SMA200D, so the long-term structure is still bearish.
DIVERGENCES & TRENDS
- Price made a lower low in late October (~$22.4), but RSI bottomed at about 28.5, a similar or higher level than earlier oversold readings. This is a mild bullish momentum improvement, not a clean divergence.
- Crossovers:
- The MACD bullish crossover came on Nov 4.
- +DI crossed above −DI on Nov 4.
- Price reclaimed EMA21, EMA55 and SMA50D within three sessions (Nov 4–6).
- Longer-term trend: Price is still below SMA200D ($27.70) and VWAP ($27.33). The 200D has been sloping down all year, and the year's highs have been lower (~$30.6 → ~$28.4 → ~$26). The primary trend remains down, so this is a counter-trend recovery that must prove itself.
- CMF is flat near zero while price and RSI surged, a modest non-confirmation.
CHART PATTERNS
- Bullish Falling Wedge (reversal): The August–October decline shows lower highs and lower lows in a narrowing channel, and the latest surge broke above the upper trendline. This is the closest match in the reference diagram. The measured target is a retracement toward the wedge's start, around $26–27, which lines up with the Sep breakdown zone and the 200D/VWAP cluster.
- Caveat (Bearish Flag/Rising Wedge risk): Within a larger downtrend, this bounce could be a counter-trend relief rally that fails below $26–27. Failure back under $24.46 would negate the wedge breakout.
- Overall: The structure is a mid-range reversal attempt with major resistance at $26–27.7.
POTENTIAL SCENARIOS
- Scenario 1: Bullish Falling-Wedge Follow-Through — Price holds the $24.46–$24.65 MA cluster and pushes through the upper Bollinger Band as EMA21 crosses above EMA55 and MACD heads toward zero. Trigger: daily close above $25.34 on healthy volume. Target: $26.00–$27.00 (prior breakdown zone, approaching VWAP/SMA200). Invalidation: daily close below $23.94 (EMA21). (50% probability)
- Scenario 2: Bearish Failed Relief Rally — The bounce stalls near the upper band and the death-cross, below-SMA200 structure reasserts itself. Price rolls over and revisits the October lows. Trigger: rejection at $25.30 and a close below $24.46 (SMA50). Target: $22.40–$23.20. Invalidation: close above $26.00. (30% probability)
- Scenario 3: Neutral Range Consolidation — Price digests the rally between the moving-average support and the $25.3–$26 resistance. Trigger: ADX stays below 25 with CMF near 0. Target: $24.00–$25.50. Invalidation: close outside $23.50–$26.00. (20% probability)
PRICE TARGETS
- Target Price: $25.90 (55-day horizon, ~Jan 2, 2027)
- Expected Range: $23.20 to $27.00. Width is $3.80, or about 15.3% of the current price, which fits the 30–60 day guidance (12–18%).
- Key Levels: Support at $24.46 (SMA50D; EMA21 at $23.94 and the $22.38 lower band are deeper support), Resistance at $25.34 (upper Bollinger Band; next at $27.33 VWAP / $27.70 SMA200D)
OVERALL BIAS
OVERALL BIAS: BULLISH - Price has reclaimed the EMA21, EMA55 and SMA50D, the MACD and DI crossovers are bullish, RSI has recovered to 61, and the wedge breakout points to a retracement toward $26–27. The bias is moderate because price remains below the falling SMA200D and VWAP, and CMF is only neutral.
This is educational analysis and not financial advice.