BB 83-day bullish forecast — Nov 8, 2026
- Bias: Bullish
- Timeframe: 83 days (made Nov 8, 2026, target date Jan 29, 2027)
- Price at analysis: $8.74
- Price target: $9.35
- Expected range: $7.85 – $10.10
- Result: Pending — graded after the close on Jan 29, 2027
Get a free AI analysis of BB today
Analysis
TECHNICAL INDICATORS
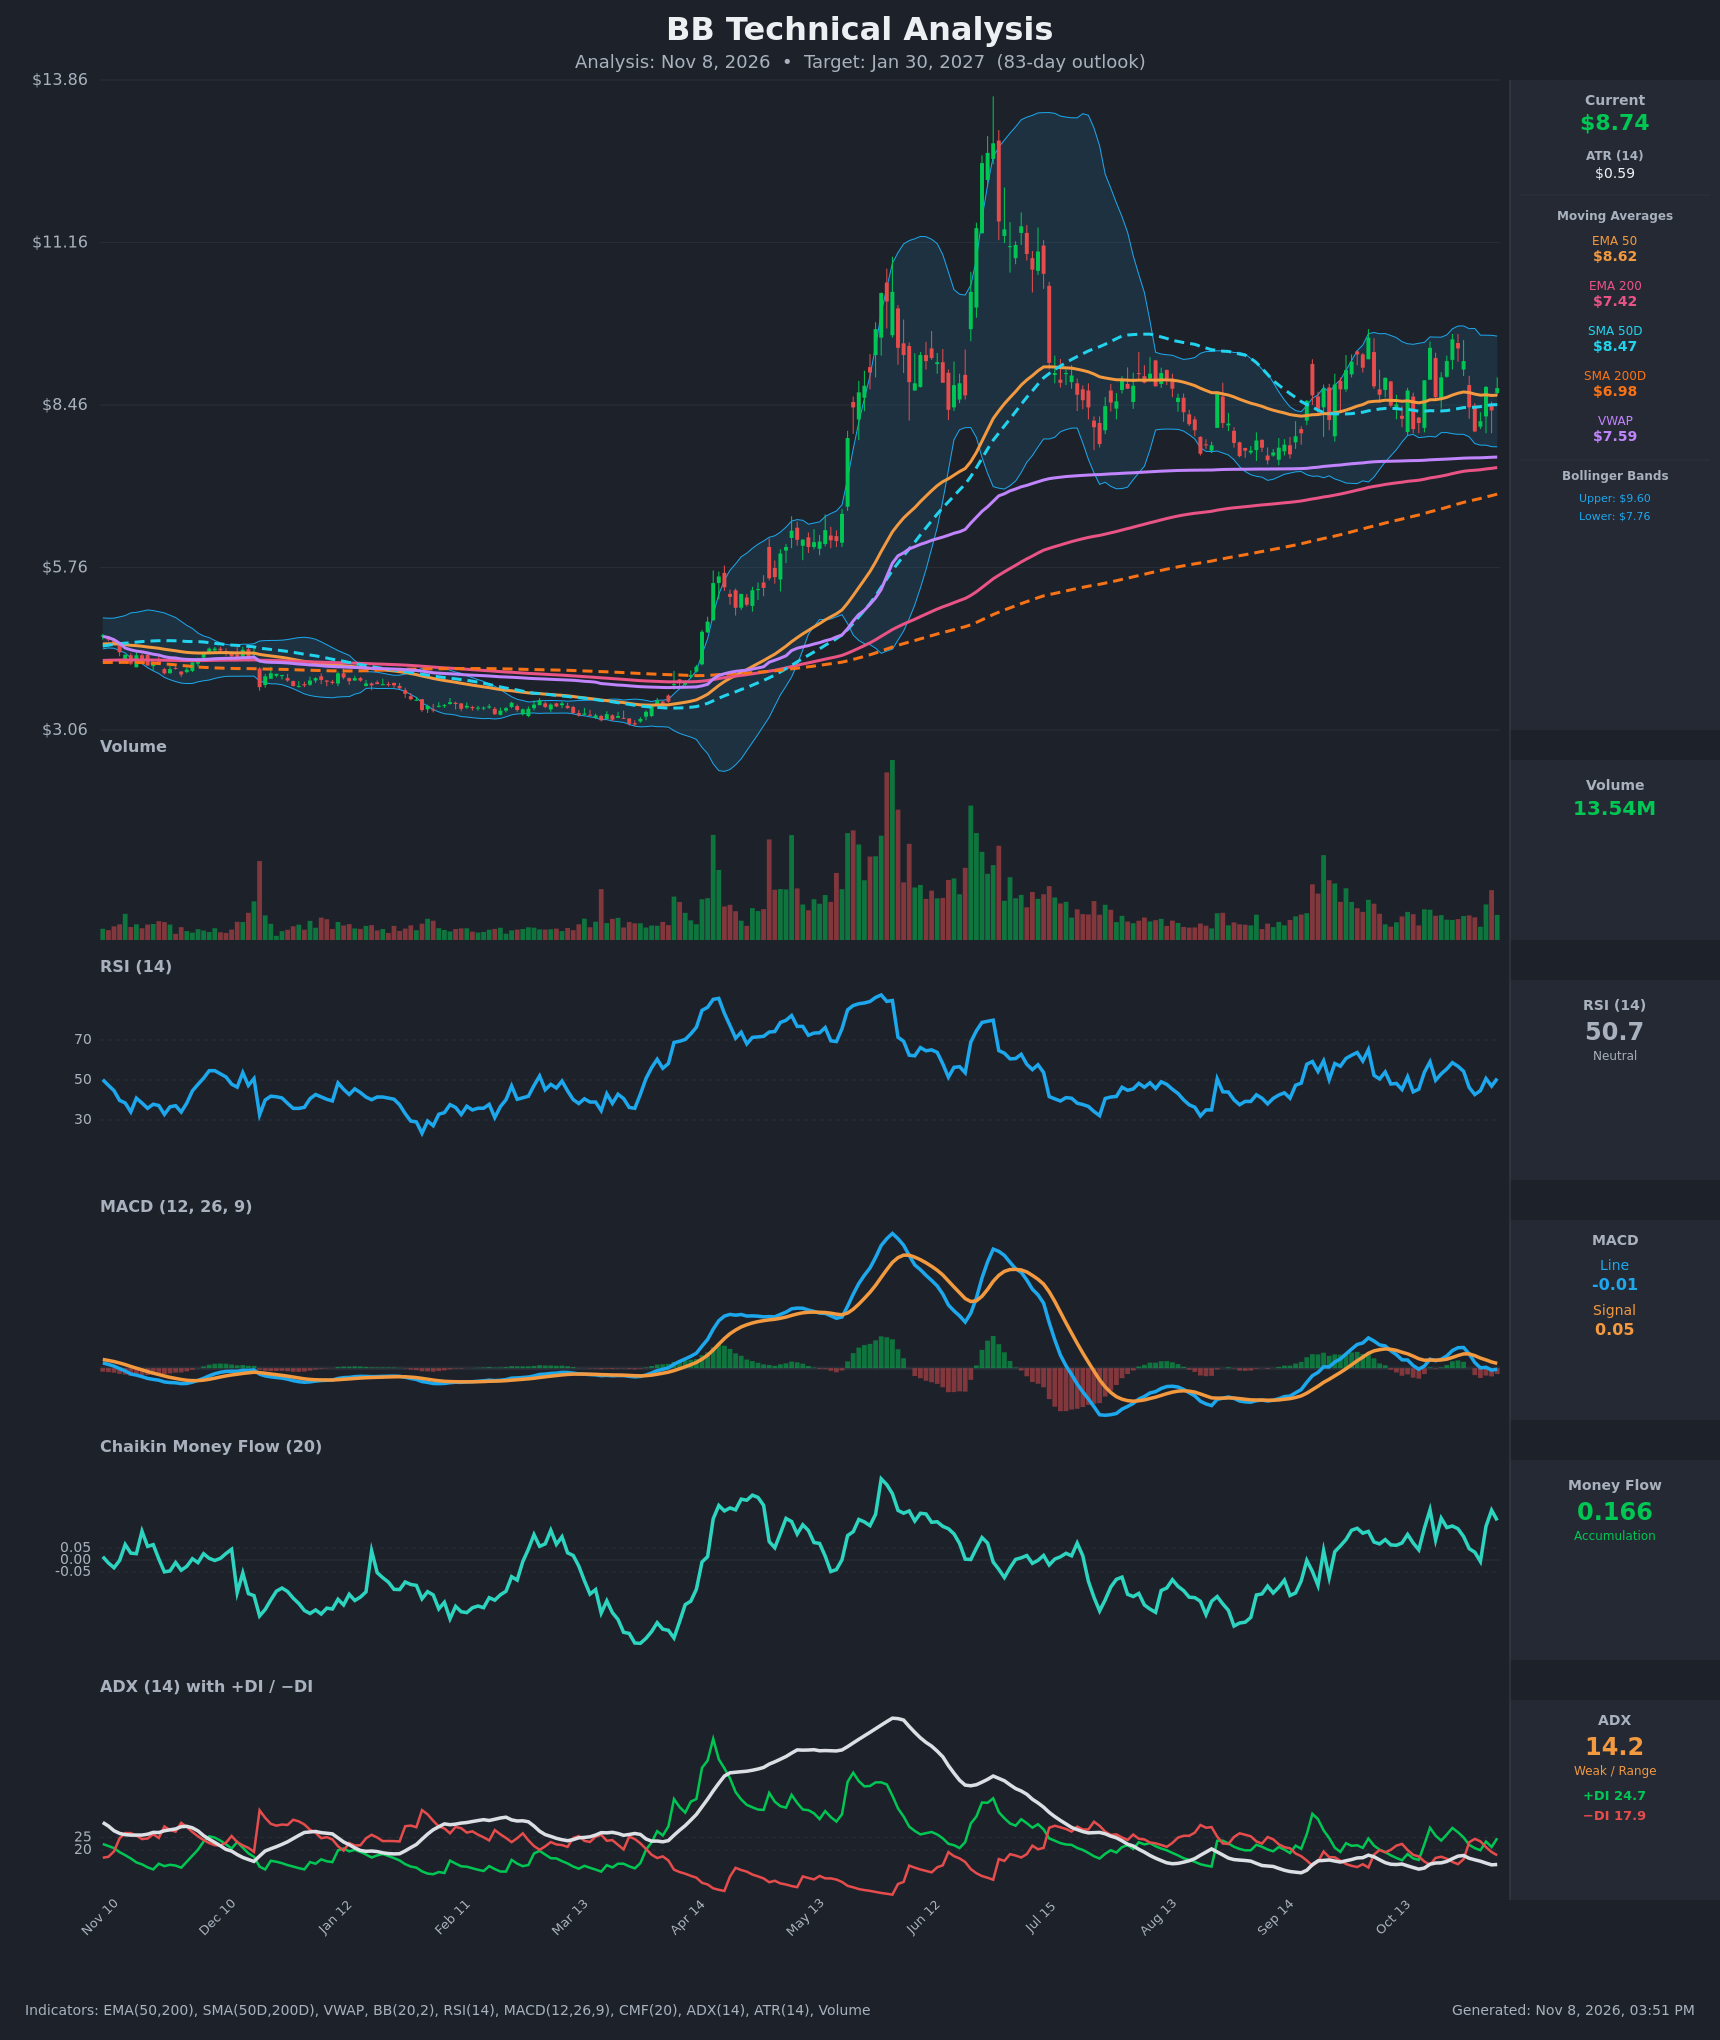
- RSI (14): 50.69, dead neutral. It has oscillated between 43 and 59 for the past two weeks without a trend, and it has stayed in the 40-60 band since July. [Neutral]
- 20 EMA: The 20 EMA is not supplied, so I use the Bollinger midline (the 20-period SMA) at about $8.68 as a proxy. Price at $8.74 is just above it, and the EMA50 at $8.62 also sits just below price. Short-term support is thin but intact. [Neutral]
- MACD: Line -0.010 is below signal 0.046, and the histogram is slightly negative. The line crossed below the signal on Oct 30, and both are hovering near zero. Momentum is fading, but the reading is shallow and the line has flattened at -0.01 rather than accelerating down. [Bearish]
- Bollinger Bands (20): Upper $9.60 and lower $7.76, so the bands are about 21% wide and price is mid-band. The bands are moderately wide after the Oct 21-27 spike to $9.55 and are not squeezing. There is no breakout signal, and a rejection near the upper band is the latest swing. [Neutral]
- CMF (20): 0.166, well above +0.05, and positive in 14 of the last 15 bars (it dipped to -0.006 on Nov 3). Buying pressure is persistent even while price chops sideways, a mild accumulation signal. [Accumulation]
- ADX (14): 14.2, which is weak and below 20, and it has been falling from 17.8. +DI (24.7) is above −DI (17.9), so bulls hold a modest edge, but there is no real trend. [Weak Trend, bullish DI tilt]
- Volume: 13.54M, in line with the recent average. Volume spiked on the Sep-Oct advance (green bars on the push toward $9.5) and is not expanding on the pullbacks, so selling is not heavy. [Neutral to mildly Bullish]
DIVERGENCES & TRENDS
- Moving-average structure: Price ($8.74) is above EMA50 ($8.62), SMA50 ($8.47), VWAP ($7.59), EMA200 ($7.42) and SMA200 ($6.98). The golden cross happened months ago and the 200-period averages are still rising, so the long-term trend is up.
- Consolidation: Since the July pullback, price has held a $7.30-$9.60 range. The Sep low near $7.3 was above the April breakout area, so the structure is still a high-level base after the spike to $13.
- CMF vs. price: CMF is trending higher (a positive divergence) while price is flat, which suggests accumulation.
- MACD vs. price: MACD is rolling over (a bearish crossover on Oct 30) while price holds near $8.7, a mild short-term caution.
- ADX: ADX is at 14.2, so any move is not yet a trend. DI lines crossed bearishly on Oct 30 and then flipped back bullish on Nov 4, a sign of whipsaw.
- Pullback support: The Nov 2 low of $8.02 held, and price bounced back above the EMA50 and SMA50.
CHART PATTERNS
- Rectangle or symmetrical-triangle consolidation: Price is coiling between roughly $8.0 and $9.55 inside the wider $7.3-$9.6 range. Compared with the reference diagram, this most resembles a rectangle or Symmetrical Triangle continuation inside a longer uptrend. The measured-move target from a breakout above $9.60 is roughly $10.5-$11.8, though I expect only partial progress within 83 days.
- Minor double top: The highs of $9.41 (Oct 21) and $9.55 (Oct 27) resemble a Bearish Double Top, with a neckline near $8.02-$8.19 (Nov 2-3 lows). A close below $8.0 would activate it, with a measured target near $6.9-$7.3. The pattern is only minor because CMF and the rising MAs conflict with it.
- Broader base: The Sep-Nov higher lows above the SMA50 resemble a Bullish Flag or base after the earlier rally.
POTENTIAL SCENARIOS
- Scenario 1: Bullish Range Breakout — Accumulation (CMF 0.166), price above all major MAs, and +DI over −DI favor an upside resolution of the consolidation. Trigger: close above $9.60 (upper Bollinger Band and range top) on rising volume. Target: $10.20-$10.80. Invalidation: close back below $8.02. (45% probability)
- Scenario 2: Neutral Range-Bound Chop — Weak ADX and a flat RSI keep price oscillating between the SMA50 and the range top. Trigger: failure at $9.55 and support holding at $8.47. Target: $8.30-$9.30. Invalidation: close above $9.60 or below $8.00. (30% probability)
- Scenario 3: Bearish Breakdown — The bearish MACD crossover and the minor double top lead to a break of the Nov 2 low. Trigger: close below $8.00. Target: $7.40-$7.60 (lower band, EMA200 and VWAP zone). Invalidation: reclaim of $8.75-$9.00. (25% probability)
PRICE TARGETS
- Target Price: $9.35 (83 days, Jan 30, 2027)
- Expected Range: $7.85 to $10.10. Width is $2.25, about 25.7% of the current price, which fits the 61-180 day guidance of 18-30%.
- Key Levels: Support at $8.47 (SMA50), with deeper support at $8.02. Resistance at $9.60 (upper Bollinger Band and range top).
OVERALL BIAS
OVERALL BIAS: BULLISH - Price sits above every major moving average in a long-term uptrend, CMF shows persistent accumulation, and +DI leads −DI. These outweigh the shallow MACD rollover and the weak ADX, which limit conviction to modest, with $9.60 the key breakout level.
This is educational analysis and not financial advice.