IWM 83-day bearish forecast — Nov 8, 2026
- Bias: Bearish
- Timeframe: 83 days (made Nov 8, 2026, target date Jan 29, 2027)
- Price at analysis: $273.67
- Price target: $264.00
- Expected range: $240.00 – $292.00
- Result: Pending — graded after the close on Jan 29, 2027
Get a free AI analysis of IWM today
Analysis
TECHNICAL INDICATORS
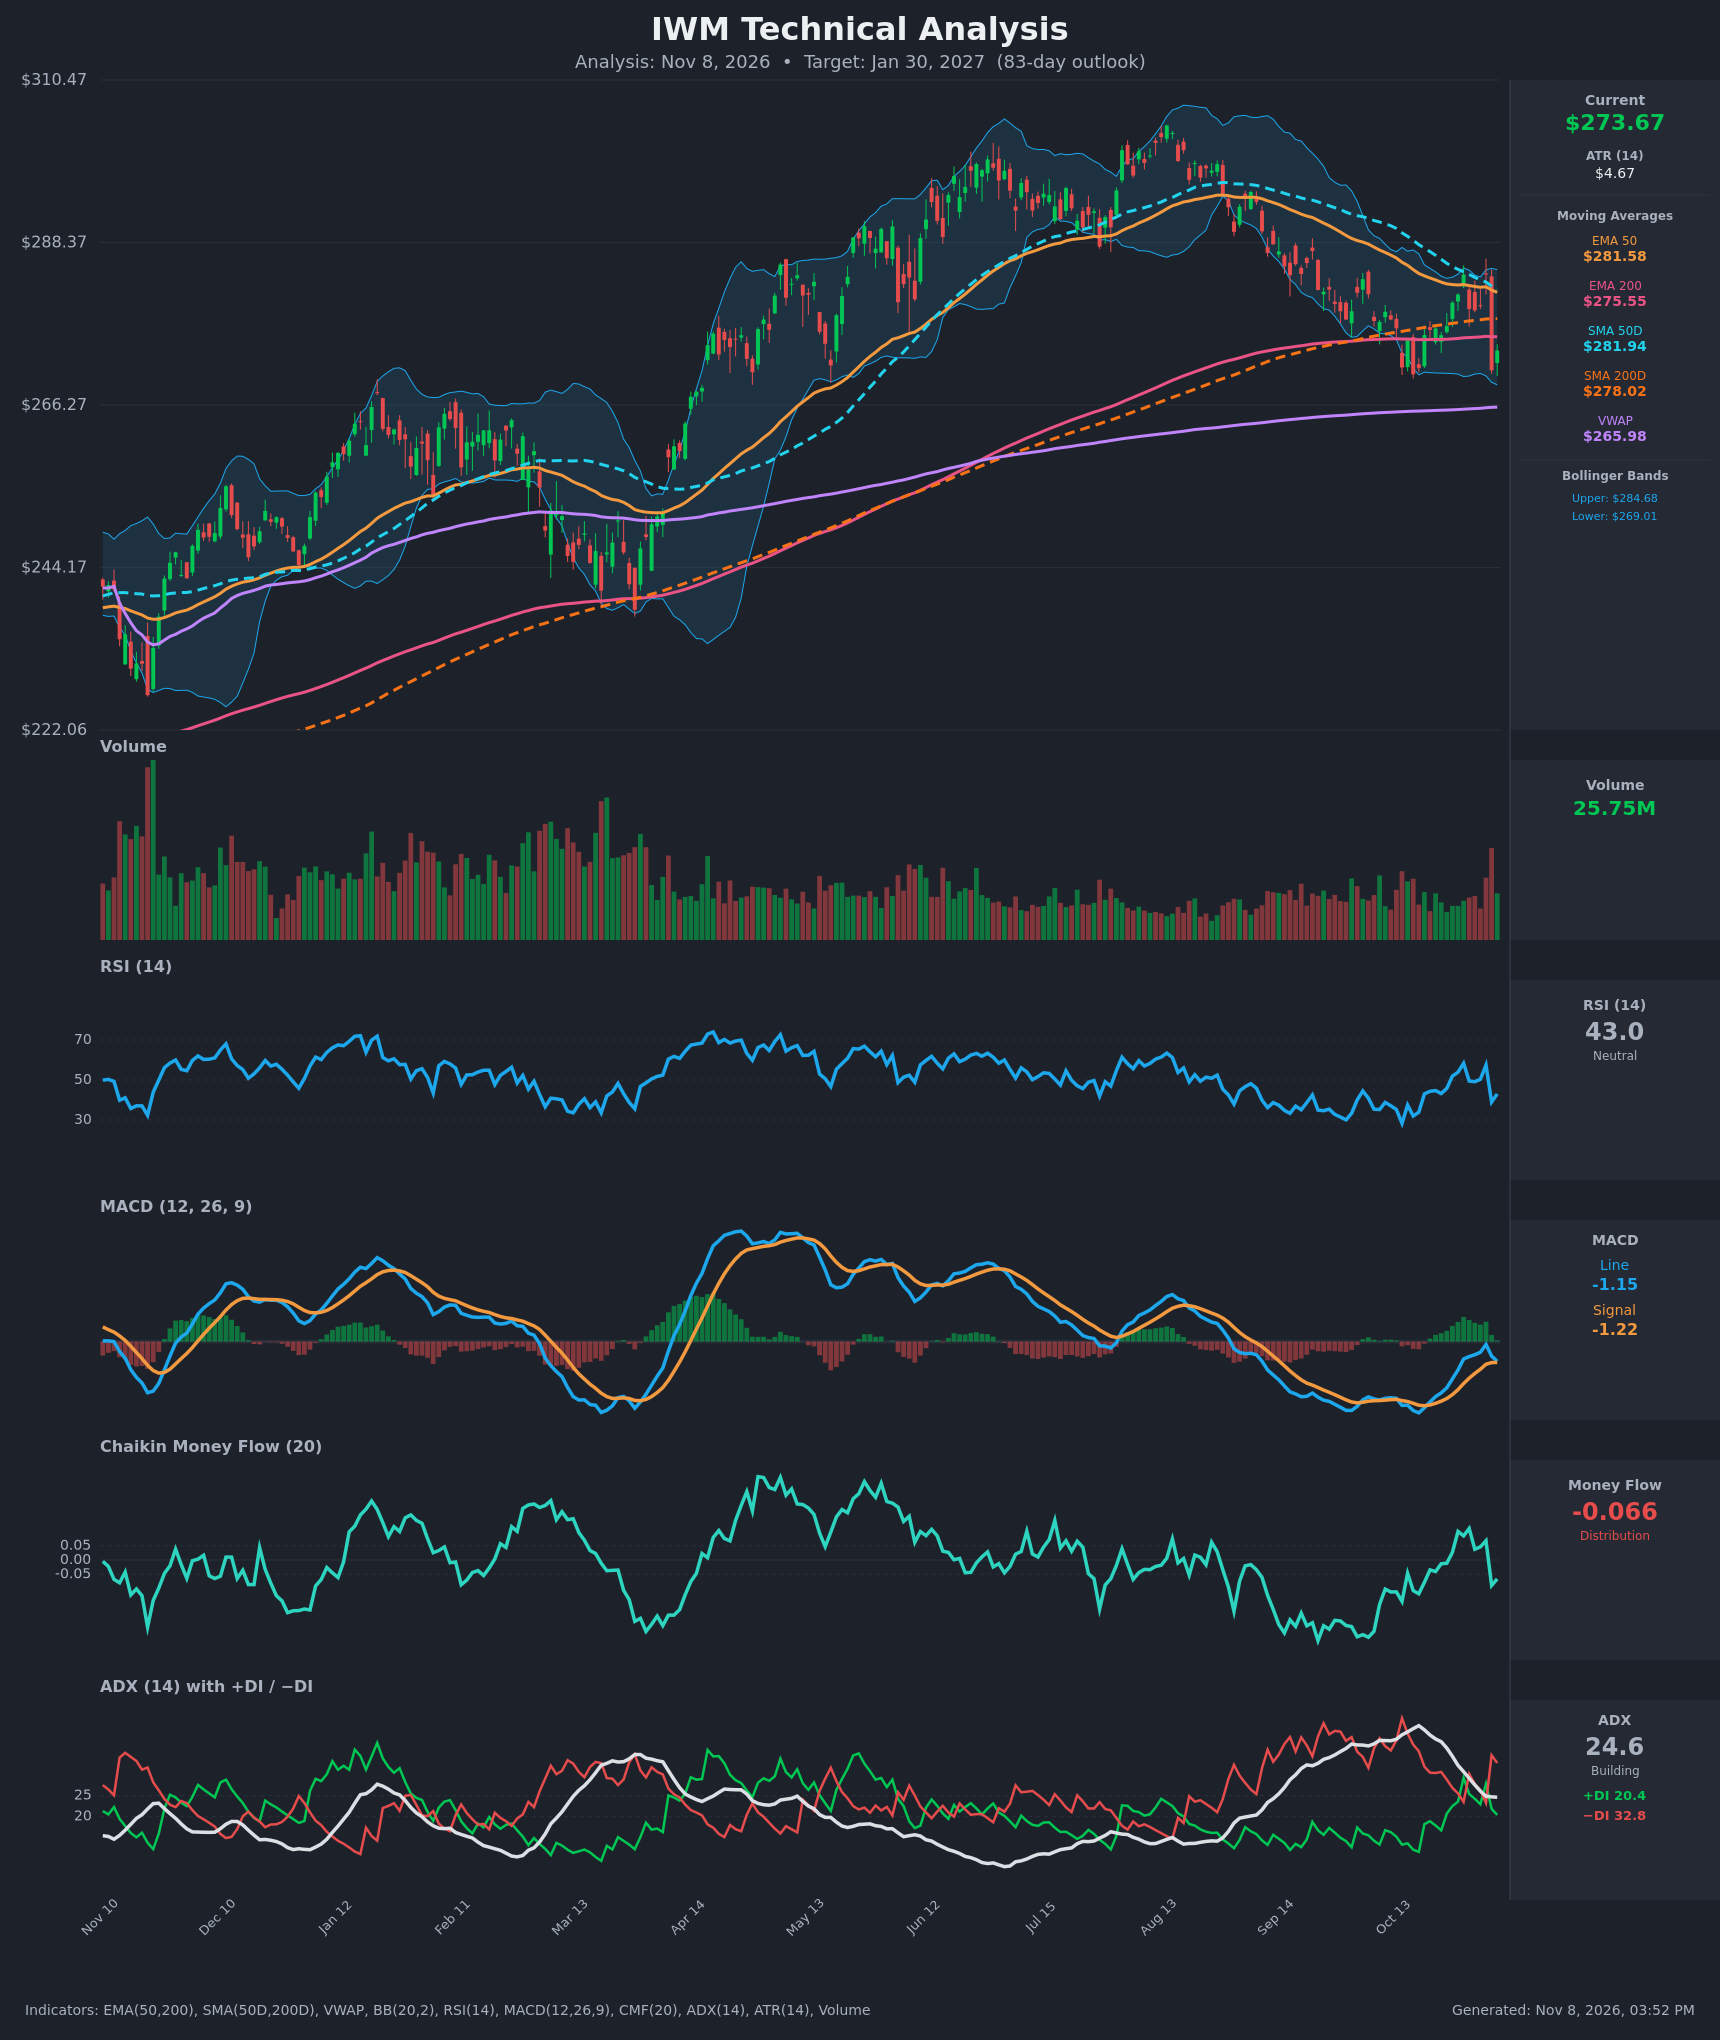
- RSI (14): 43.05, below the 50 midline and well off the 58 reached on Oct 29 and the 57.5 on Nov 4. It spiked to 57.5 and then fell to 39 in one session, so momentum is weak with no oversold condition yet. [Bearish]
- 20 EMA: The 20 EMA is not supplied. The Bollinger midline (20-period basis) is about $276.84, and price at $273.67 sits below it. The EMA50 at $281.58 and SMA50D at $281.94 are overhead resistance, and price is also below the EMA200 ($275.55) and SMA200D ($278.02). [Bearish]
- MACD: Line -1.155, signal -1.216, so the line is a hair above the signal (about +0.06) after a marginal bullish cross. Both lines are below zero and the line fell from -0.167 to -1.155 in two sessions, so the histogram is fading toward a bearish re-cross. [Bearish]
- Bollinger Bands (20): Upper $284.68, lower $269.01, with price in the lower third. The Nov 4 close at $284.02 tagged the upper band and was rejected with a -4.6% drop on Nov 5. The bands are fairly narrow, so a volatility expansion is likely. [Bearish]
- CMF (20): -0.066, below the -0.05 threshold. It turned positive (up to +0.11) in late October, then fell back to distribution on the Nov 5 selloff. [Distribution]
- ADX (14): 24.6, near the trend threshold and fading from 41.7 (a mid-October peak). −DI (32.8) is far above +DI (20.4), so sellers control the trend. ADX turning lower while −DI leads means the downtrend is maturing and not accelerating. [Weak-to-Moderate Trend, Bearish]
- Volume: 25.75M, with a clear volume spike on the Nov 5 reversal bar, the heaviest in weeks. High-volume selling at the upper band and the 50-day averages points to institutional distribution. [Bearish]
DIVERGENCES & TRENDS
- There is no strong divergence. RSI and MACD made higher lows in late October versus the Oct 19 low (price lows were similar), a mild bullish momentum improvement. The Nov 5 reversal erased most of it.
- The Aug high near $305 was followed by lower highs and lower lows, a clear intermediate downtrend. The rally to $284 failed at the falling SMA50D/EMA50 cluster.
- SMA50D ($281.94) is converging on SMA200D ($278.02) with a slope of roughly -0.5 per day. A death cross is probable within a few weeks. EMA50 ($281.58) is also converging on EMA200 ($275.55).
- Price is now below both the EMA200 and the SMA200D, which is a long-term trend warning. VWAP ($265.98) is the next major anchor below.
- ADX has rolled over from 41 to 24.6, which suggests the first leg of the decline is losing steam. That raises the odds of consolidation or a bounce attempt, but it does not turn the trend.
CHART PATTERNS
- The chart most resembles a Bearish Head and Shoulders / broad topping structure. The Aug peak (~$305) is the head, the Jan–Jul swings form the left side, and the late-Oct to Nov rally to $284 is a lower right shoulder. The "neckline" runs through the Oct lows (~$269–270) and the 200-day cluster ($275–278).
- A decisive close below ~$269 would confirm the neckline break. The measured move from head (~$305) to neckline (~$269) is about $36, which projects to about $233 over a longer horizon.
- A rebuilt Bearish Double Top (the Aug high and the Nov 4 rejection) is less clean, since the second peak is much lower.
- Over 83 days I treat the target as partial progress toward the measured move, not the full projection.
POTENTIAL SCENARIOS
- Scenario 1: Bearish Neckline Break — Price fails again at the SMA200D/EMA200 cluster, the death cross forms, and the Oct lows give way. Trigger: Daily close below $269 with −DI staying above +DI and CMF below -0.05. Target: $262–$255, with a VWAP test at ~$266 first. Invalidation: Daily close above $282 (EMA50/SMA50D). (50% probability)
- Scenario 2: Bullish Reclaim and Recovery — The Oct low holds as a double-bottom-style base, price reclaims the 200-day averages, and it retests the Aug highs area. Trigger: Close above $278 on rising volume with MACD turning positive. Target: $284–$292. Invalidation: Close below $269. (30% probability)
- Scenario 3: Neutral Range Chop — Price oscillates between ~$266 and ~$282 as ADX fades below 20. Trigger: Repeated failures at both $269 and $280 with muted volume. Target: $270–$278. Invalidation: Daily close outside $265–$284. (20% probability)
PRICE TARGETS
- Target Price: $264.00 (83-day, about -3.5% from current)
- Expected Range: $240.00 to $292.00 (width $52 = about 19.0% of current price, consistent with the 61–180 day guidance and much wider than a 14-day range)
- Key Levels: Support at $269.00 (Bollinger lower band and Oct lows; next at $265.98 VWAP), Resistance at $278.00 (SMA200D, then $281.94 SMA50D)
OVERALL BIAS
OVERALL BIAS: BEARISH - Price is below the EMA200, SMA200D, EMA50 and SMA50D after a high-volume rejection at the upper Bollinger Band. −DI dominates +DI, CMF shows distribution, and the 50/200 averages are converging toward a death cross. A fading ADX and a hold of the $269 support keep conviction moderate.
This is educational analysis and not financial advice.