KWEB 83-day bullish forecast — Nov 8, 2026
- Bias: Bullish
- Timeframe: 83 days (made Nov 8, 2026, target date Jan 29, 2027)
- Price at analysis: $24.88
- Price target: $26.30
- Expected range: $22.70 – $28.60
- Result: Pending — graded after the close on Jan 29, 2027
Get a free AI analysis of KWEB today
Analysis
TECHNICAL INDICATORS
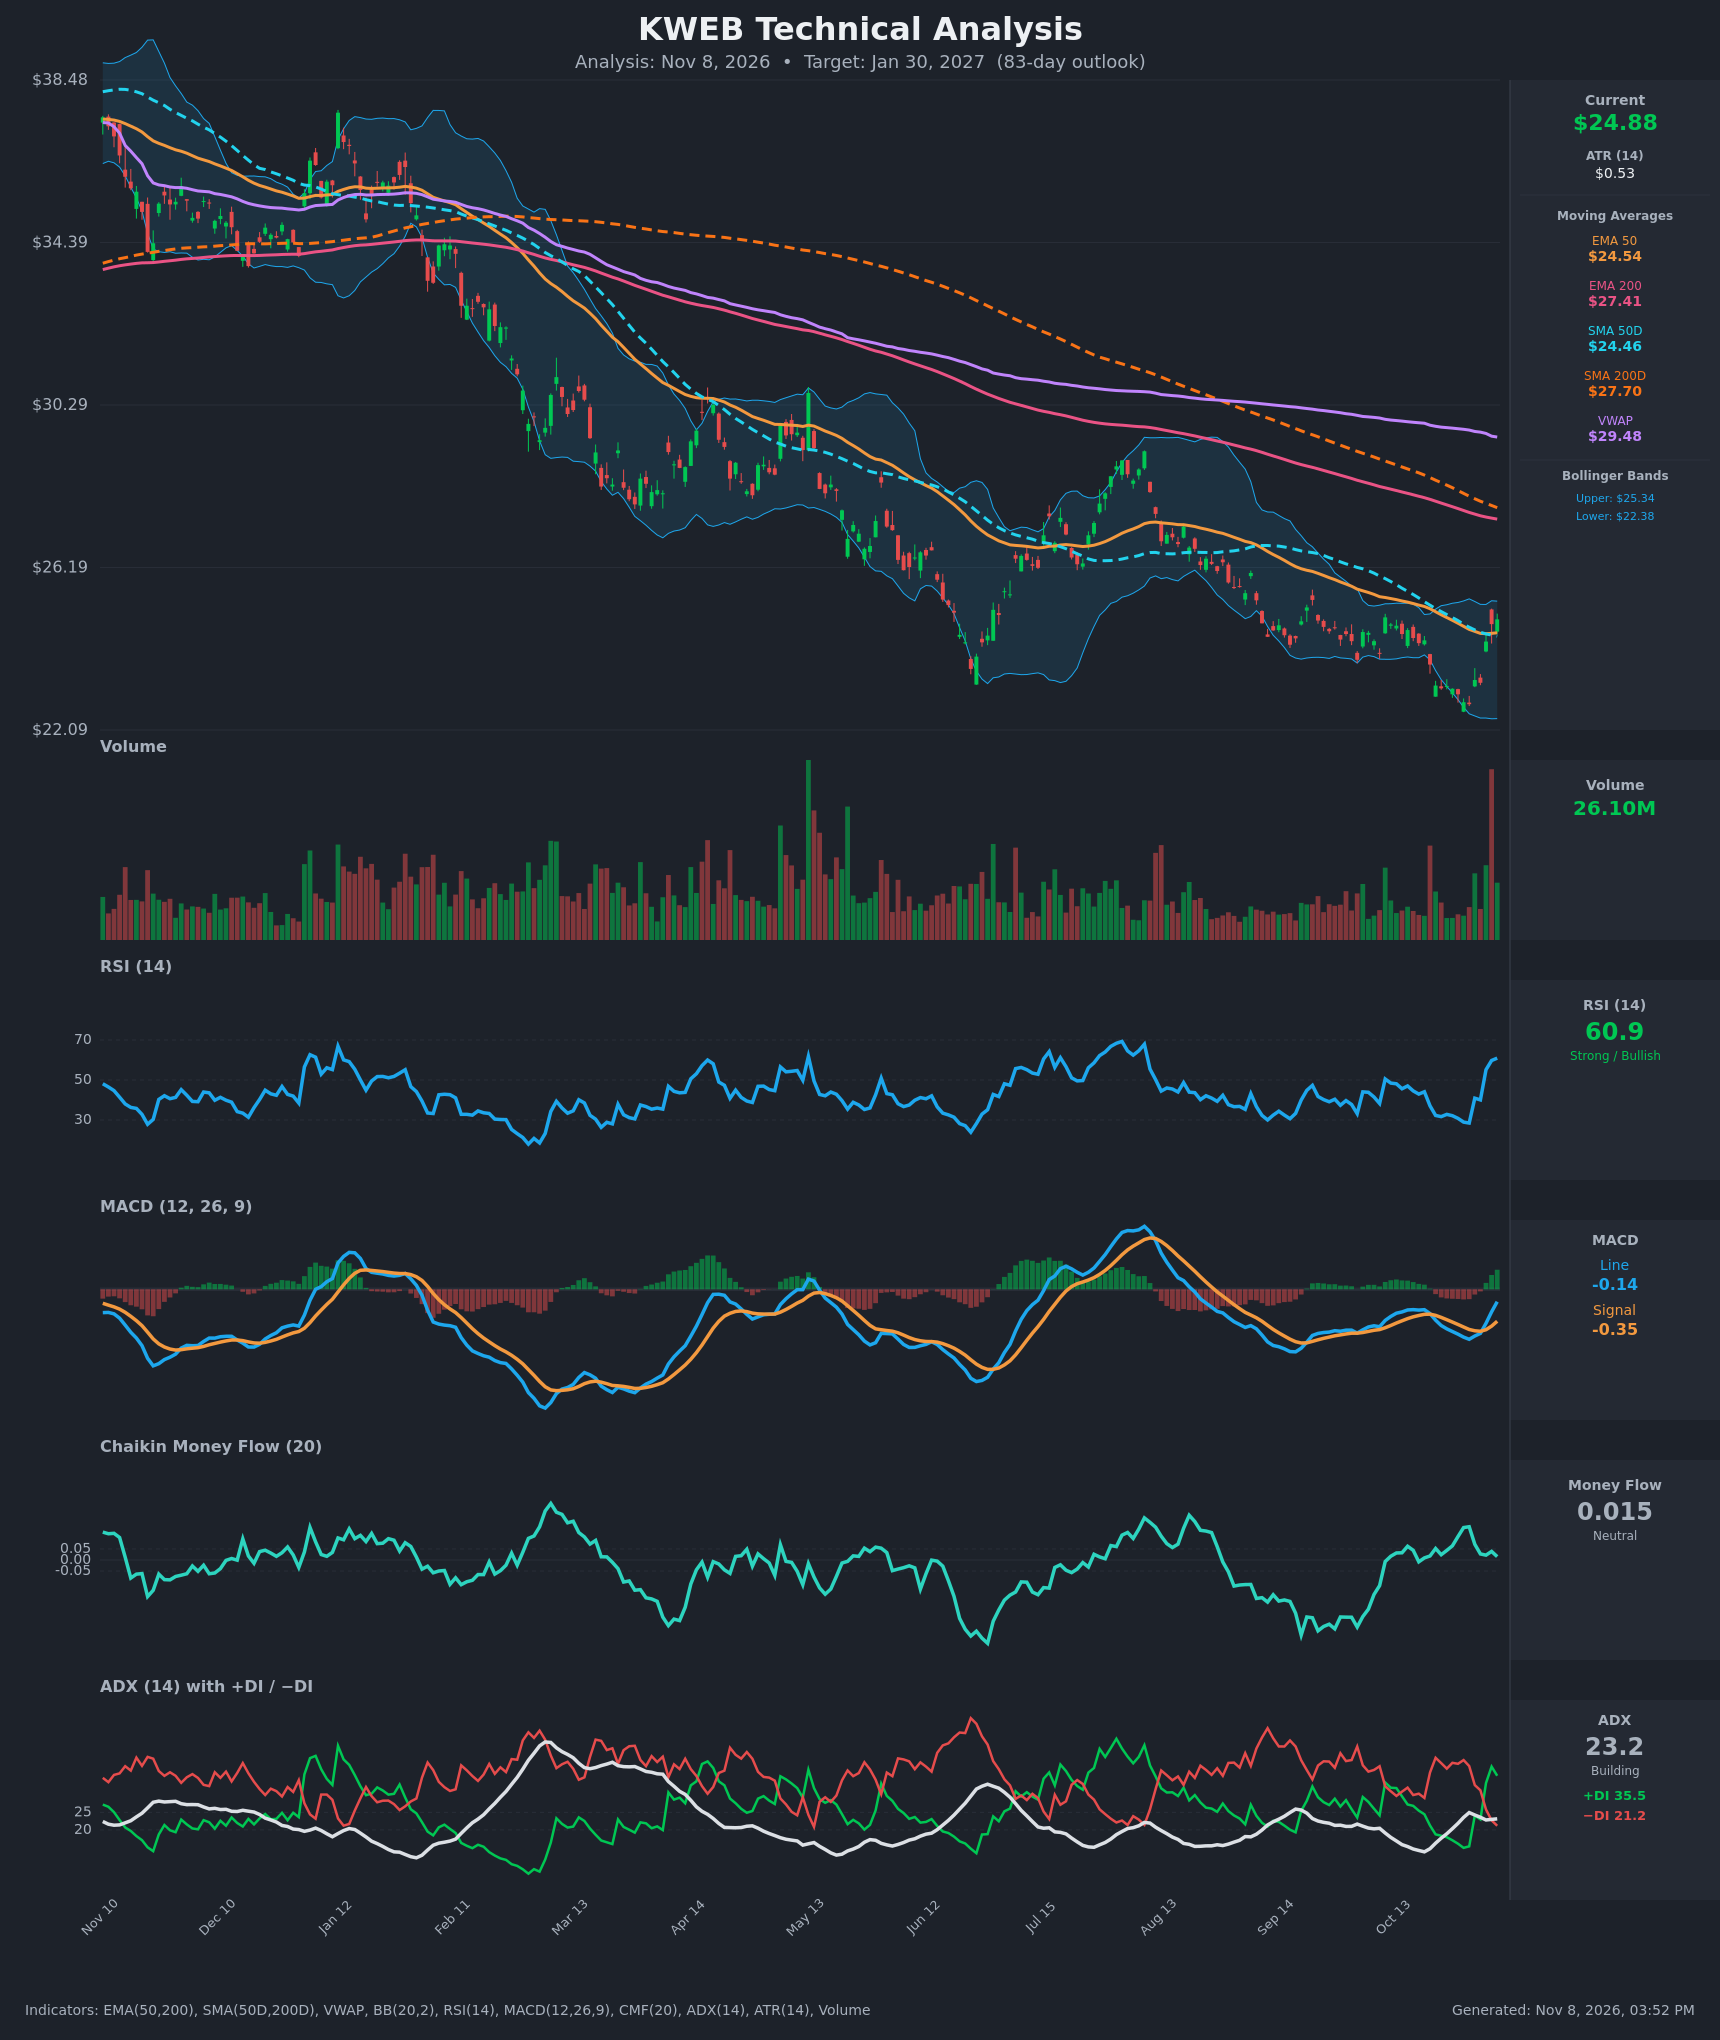
- RSI (14): 60.93, up sharply from 28.5 on Oct 30 (about 32 points in a week). It is approaching the 70 overbought line but has room to run. It is the strongest reading since the July–August bounce. [Bullish]
- 20 EMA: The 20 EMA is not provided. The EMA 50 ($24.54) and SMA 50D ($24.46) are the closest proxies. Price at $24.88 has reclaimed both and is above them for the first time in weeks, so they now act as support. [Bullish]
- MACD: The line is -0.136 and the signal is -0.351. The line has risen for six straight bars, from -0.550. The histogram has flipped positive (about +0.21) and is expanding. A bullish crossover has just occurred, but it is still below zero, so it is an early, counter-trend signal. [Bullish]
- Bollinger Bands (20): Upper $25.34, lower $22.38, with price in the upper half, about $0.46 below the upper band. After riding the lower band in late October, price has snapped back to the mid-band and above. The bands are fairly narrow, so a volatility expansion is likely. Near-term upside is limited to the upper band unless it breaks out. [Bullish]
- CMF (20): 0.015, inside the neutral band (-0.05 to +0.05). It peaked at 0.151 on Oct 30 and has faded despite the price bounce. Buying pressure is not confirming the rally. [Neutral]
- ADX (14): 23.2 and building, but below 25. +DI (35.5) is well above −DI (21.2), after a bearish DI regime through October. The bullish DI crossover on Nov 4 shows control shifting to buyers. The trend is still only modest in strength. [Weak-to-Moderate Trend, Bullish direction]
- Volume: 26.10M, with a large volume spike near the end of the chart and bullish-day volume rising. The volume spike marks a capitulation or reversal event near the $22.70 low. Follow-through volume on up days is encouraging but not yet decisive. [Mild accumulation / reversal volume]
DIVERGENCES & TRENDS
- Price made a lower low at about $22.70 in late October, close to the June low near $23.20. RSI bottomed at 28.5, close to the June RSI low (about 27), so there is no clear bullish RSI divergence, but selling momentum has clearly exhausted.
- The MACD line has crossed above its signal line, and price has crossed above the 50-day averages. Both are short-term bullish breaks.
- CMF is falling (0.151 to 0.015) while price rises, a mild bearish divergence that suggests the bounce lacks strong accumulation.
- The long-term structure is still bearish.
- Price is below the EMA 200 ($27.41) and the SMA 200D ($27.70).
- Both 200-period averages are still sloping down.
- Price is far below VWAP ($29.48).
- The SMA 50D (24.46) remains well below the SMA 200D (27.70), so the death cross stays in force.
- The EMA 50 is also below the EMA 200.
- Earlier rallies in this downtrend (Feb, May and Aug) failed at or near the declining 50-day average or the Bollinger upper band. This one has now pushed above the 50s, a step further than the last attempt.
CHART PATTERNS
- Bullish Double Bottom (developing): The lows near $23.20 (June) and $22.70 (late October) form a potential double bottom. The neckline is around $28, the Aug–Sep swing high. A confirmed break would project a measured move toward $33. That is well outside the 83-day base case, so I treat it only as a longer-term possibility.
- Falling wedge / large descending channel: The year-long sequence of lower highs and lower lows resembles a large falling wedge or channel. Price is now testing the upper boundary and the 50-day averages. A hold above $24.50 keeps this reversal setup alive.
- Risk: A failure at $25.3–$26 would mean a lower high, which would resume the downtrend (bearish continuation).
POTENTIAL SCENARIOS
- Scenario 1: Bullish Base Breakout / Mean Reversion Toward the 200s — The bounce holds above the 50-day averages, MACD turns positive and price grinds toward the declining 200 EMA/SMA zone. Trigger: a daily close above the $25.34 upper Bollinger Band on solid volume. Target: $26.30 base case, with a stretch to $27.40–$27.70 (EMA/SMA 200). Invalidation: a daily close below $24.40 (SMA 50D), and especially below $23.20. (50% probability)
- Scenario 2: Bearish Failed Bounce / Downtrend Resumes — The rally stalls at the upper band or the $26 area, forming a lower high under the falling 200-day averages and VWAP. Weak CMF fails to confirm and sellers re-take control. Trigger: rejection at $25.3–$26 followed by a close below $24.40. Target: $22.70 retest, then $21.50–$22.00. Invalidation: a daily close above $27.70. (30% probability)
- Scenario 3: Neutral Range Consolidation — Price chops between $23.20 and $26.00 as ADX stays near 20–25 and the 50-day averages act as a magnet. Trigger: repeated closes between $24.00 and $26.00. Target: $24.50–$25.50. Invalidation: a close outside $23.20–$26.50. (20% probability)
PRICE TARGETS
Timeframe: 83 days (61–180 day band, range width about 18–30%).
- Target Price: $26.30 (about +5.7% from $24.88)
- Expected Range: $22.70 to $28.60 ($5.90 width, about 23.7% of current price, consistent with the 83-day guidance)
- Key Levels: Support at $24.46 (SMA 50D, with EMA 50 at $24.54 just above it); Resistance at $27.41 (EMA 200), with minor resistance at $25.34 (upper Bollinger Band)
OVERALL BIAS
OVERALL BIAS: BULLISH - Momentum has turned up: a fresh MACD bullish crossover, RSI at 61, price reclaiming the 50-day averages and +DI over −DI after a capitulation low near $22.70. The bias is modest because price remains below the falling 200-day averages and VWAP, and CMF is flat, so a rebound toward $26–27 is more likely than a fresh breakdown.
This is educational analysis and not financial advice.