QCOM 83-day bearish forecast — Nov 8, 2026
- Bias: Bearish
- Timeframe: 83 days (made Nov 8, 2026, target date Jan 29, 2027)
- Price at analysis: $165.41
- Price target: $159.00
- Expected range: $140.00 – $180.00
- Result: Pending — graded after the close on Jan 29, 2027
Get a free AI analysis of QCOM today
Analysis
TECHNICAL INDICATORS
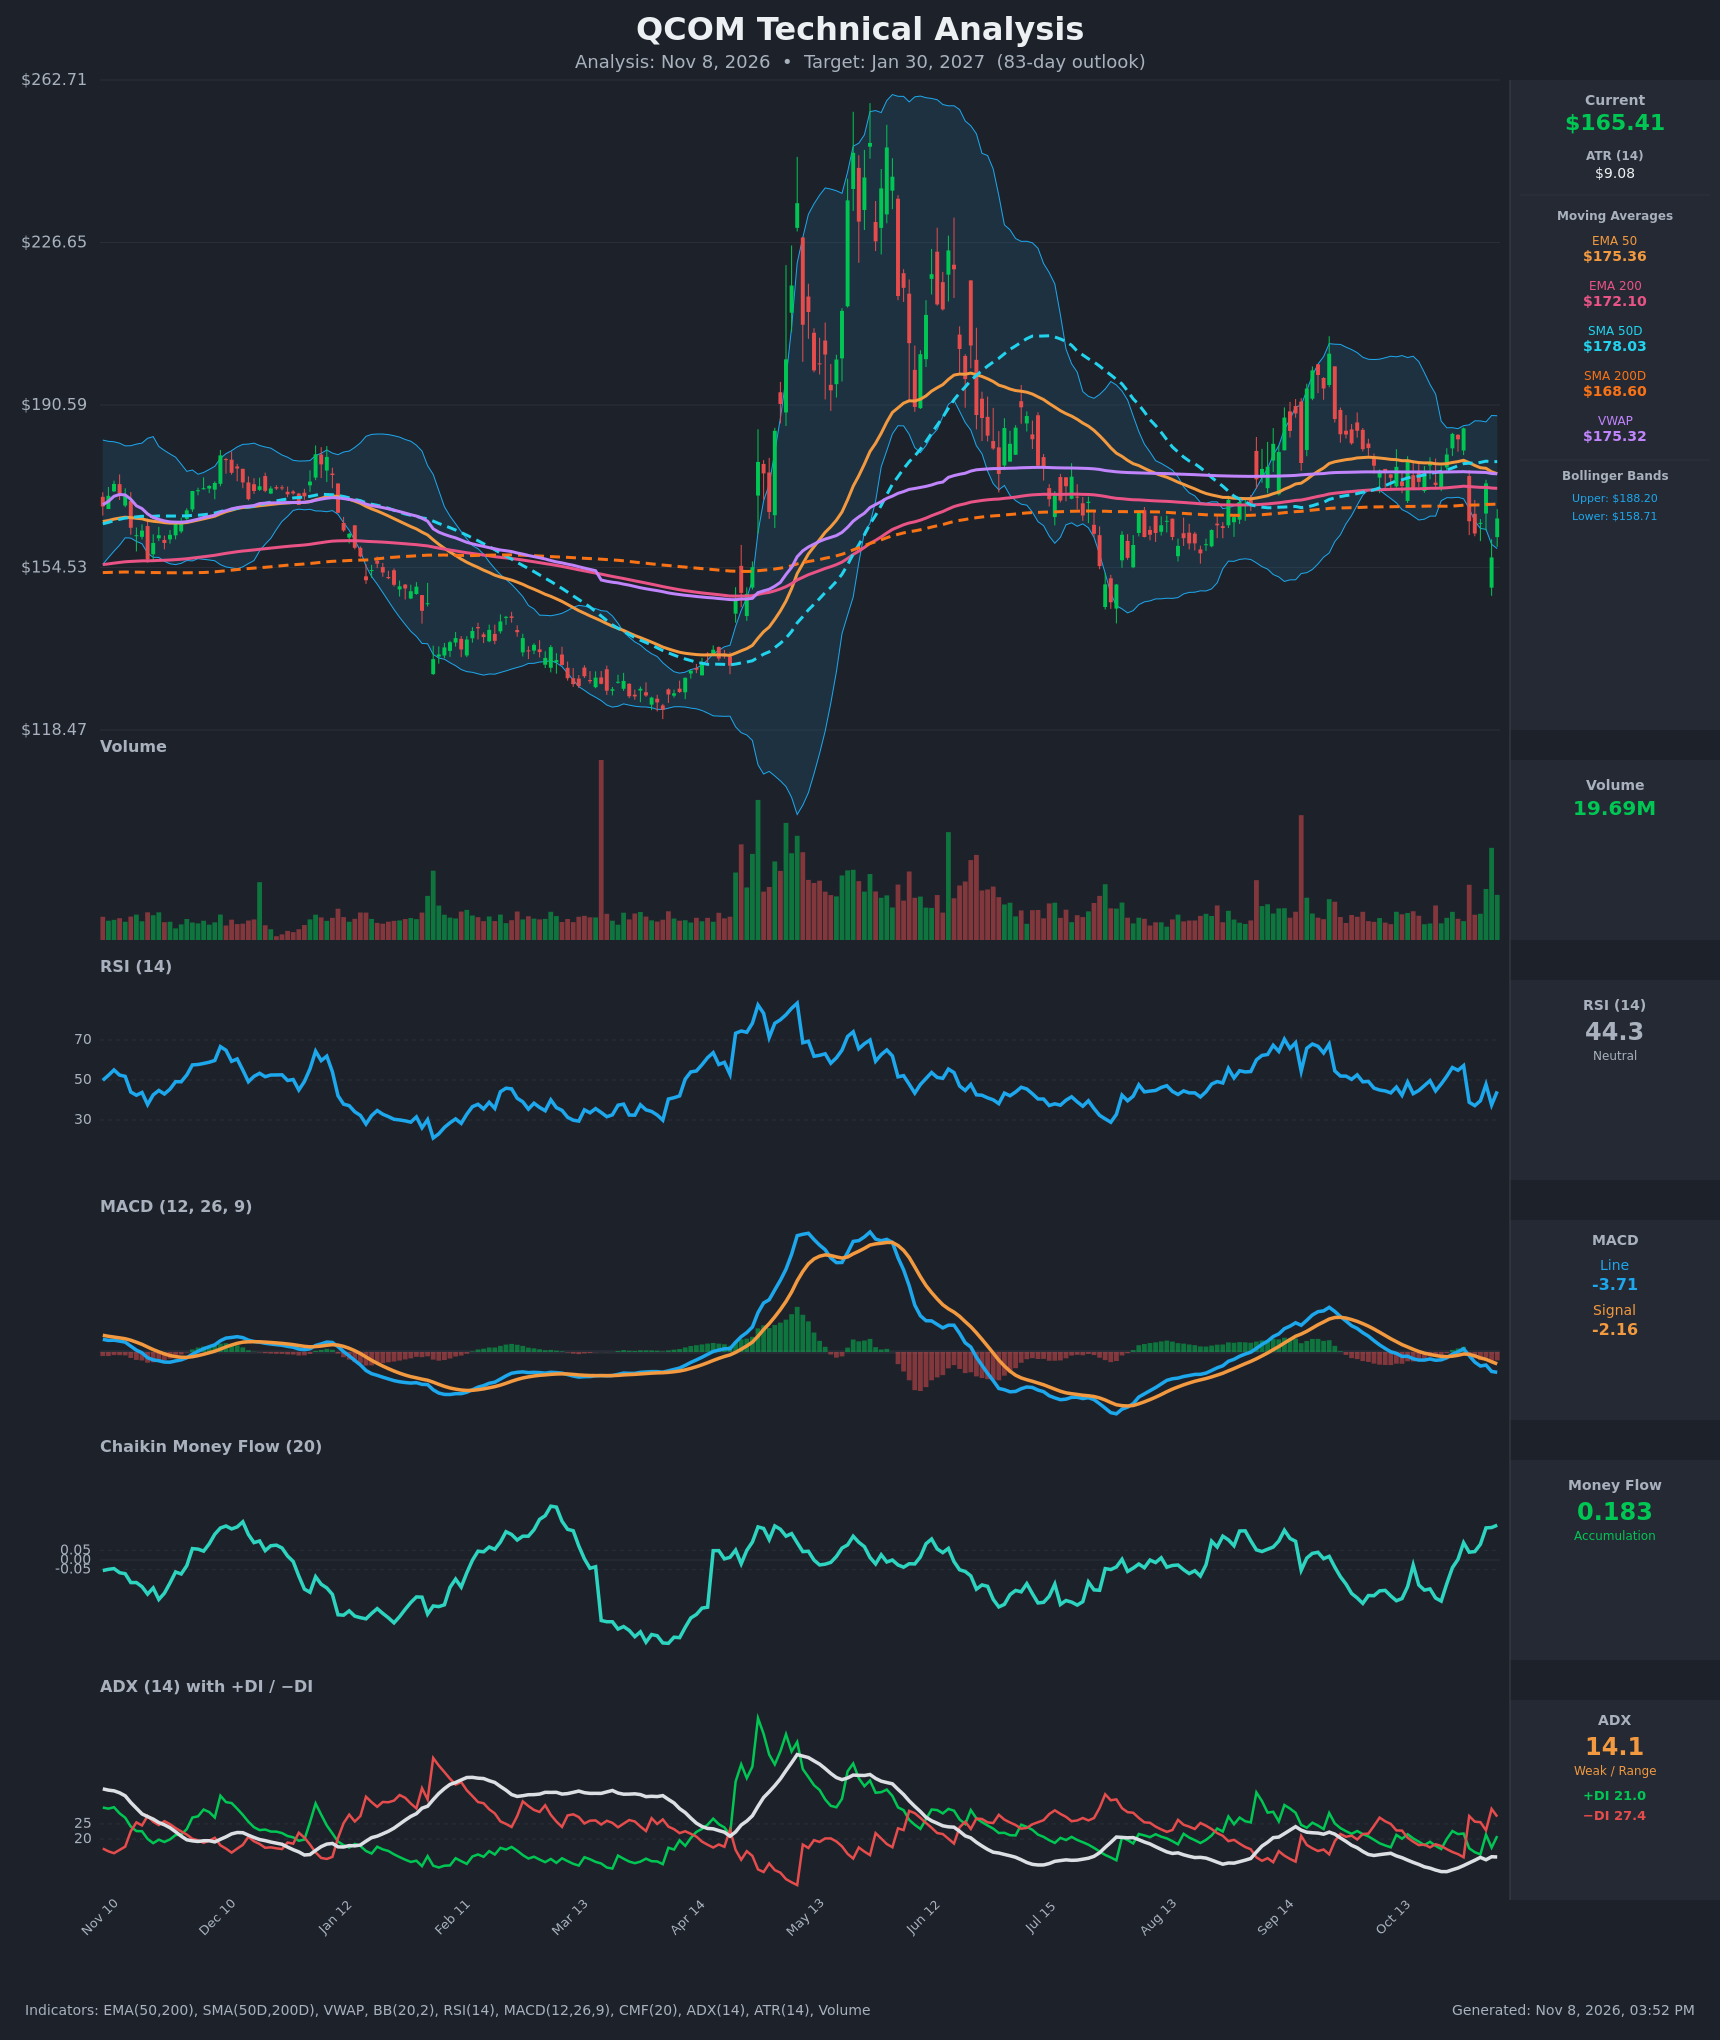
- RSI (14): 44.3, below the 50 midline but well above oversold. It bounced from 37.5 on Nov 5 but has been capped by 50 since the Oct 30 gap down, so momentum is soft. [Bearish]
- 20 EMA: Not supplied. The 50 EMA at $175.36 and 200 EMA at $172.10 both sit above price and act as overhead resistance. Price is about 5.7% below the 50 EMA, and the 50 EMA is rolling over (178.3 to 175.4 in 7 sessions). [Bearish]
- MACD: Line -3.71 is below the signal at -2.16 and the gap is widening. The bearish cross happened around Oct 30, and the histogram is increasingly negative. There is no sign of a turn yet. [Bearish]
- Bollinger Bands (20): Price is $165.41 against bands of $158.71 to $188.20, so it sits in the lower third of the bands (the midline is about $173.5). The bands are moderately wide after the earnings gap. The lower band and the $156.75 low are the nearest support, and there is no squeeze. [Neutral]
- CMF (20): +0.183 and rising from about -0.2 in late October, which is clear accumulation. Dip buyers are absorbing the selloff, but price has not yet confirmed. [Accumulation]
- ADX (14): 14.1 is a weak, range-bound reading, though the −DI (27.4) is above the +DI (21.0). Sellers lead, but trend strength is low and the downtrend is not established. [Weak Trend, bearish lean]
- Volume: 19.69M on the latest bar, well above average, with large volume on the Oct 30 and Nov 5 down days and a high-volume bounce on Nov 6. This looks like post-earnings repositioning with heavy two-way activity. [Elevated, mixed]
DIVERGENCES & TRENDS
- CMF vs. price: CMF is rising and positive (+0.183) while price is making a lower low and lower highs. This bullish divergence is the main counter to the bearish trend signals.
- MACD vs. price: MACD is making new lows (-3.71) alongside price weakness, so there is no momentum divergence.
- Moving averages: Price is below the EMA50, EMA200, SMA50D ($178.03), SMA200D ($168.60) and VWAP ($175.32). It lost the SMA200D on the Nov 5 flush, and Nov 6's close at $165.41 failed to reclaim it. EMA50 is above EMA200 and SMA50D is above SMA200D, so there is no death cross yet. However, the EMA50 and SMA50D are flattening or rolling over, and the gap is narrowing.
- Price action: The gap down from $185.41 to $164.79 on Oct 30 broke the Sep–Oct rally. The Nov 5 low of $156.75 was met with a sharp bounce, showing buyers defending that area.
- ADX/DI: −DI crossed above +DI on Oct 30, and ADX is only 14, so the move is more of a shock than a trend.
CHART PATTERNS
- Range after a failed rally: Since July, price has traded roughly $140–$205 with lower highs ($205 in Sep, then $185). This resembles a Bearish Expanding Triangle / broad range more than a clean trend, and the Oct 30 gap down fits a failed breakout.
- Possible Bullish Double Bottom: The $156–$162 zone (Nov 2 and Nov 5) is a tentative double bottom, but it needs a break above the $173–$175 neckline (the EMA50, VWAP and the Nov 4 high) to confirm. That would target about $185–$190.
- Bearish break: A close below $156.75 would open the path toward the prior swing lows around $140–$145, the measured-move target for the broad range.
- Neither pattern is confirmed yet. The weight of the evidence (price under every moving average, bearish MACD, −DI lead) slightly favors the bearish resolution.
POTENTIAL SCENARIOS
- Scenario 1: Bearish Post-Earnings Drift Lower — Price stays below the 200-day (SMA200D $168.60) and EMA50/VWAP resistance around $172–$175, with MACD still negative. Sellers retest and break the $156.75 low and the lower Bollinger Band. Trigger: daily close below $156.75, or a rejection at $168–$172. Target: $145–$152, with $159 as the 83-day central target after partial rebounds. Invalidation: daily close above $176 (EMA50/VWAP). (45% probability)
- Scenario 2: Bullish Reversal on Accumulation — CMF accumulation proves right and $156.75 holds as a higher-low base. Price reclaims the SMA200D and EMA200, then the $175 cluster. Trigger: close above $172 with a MACD bullish cross. Target: $178–$188. Invalidation: close below $156.75. (30% probability)
- Scenario 3: Neutral Range Chop — ADX stays below 20 and price oscillates between $155 and $175 around the converging moving averages. Trigger: failure to break either $156.75 or $175. Target: $160–$170. Invalidation: close outside $152–$180. (25% probability)
PRICE TARGETS
- Target Price: $159.00 (83-day, about -3.9% from $165.41)
- Expected Range: $140.00 to $180.00 (width $40, about 24.2% of current price, consistent with the 61–180 day guidance of 18–30%)
- Key Levels: Support at $156.75, Resistance at $168.60
OVERALL BIAS
OVERALL BIAS: BEARISH - Price sits below the EMA50, EMA200, SMA50D, SMA200D and VWAP, MACD is negative with a widening gap below its signal, and −DI leads after a high-volume earnings gap down. The rising CMF and the defended $156.75 low temper conviction, but the bearish evidence is slightly heavier.
This is educational analysis and not financial advice.