QQQ 83-day bearish forecast — Nov 8, 2026
- Bias: Bearish
- Timeframe: 83 days (made Nov 8, 2026, target date Jan 29, 2027)
- Price at analysis: $656.10
- Price target: $632.00
- Expected range: $575.00 – $715.00
- Result: Pending — graded after the close on Jan 29, 2027
Get a free AI analysis of QQQ today
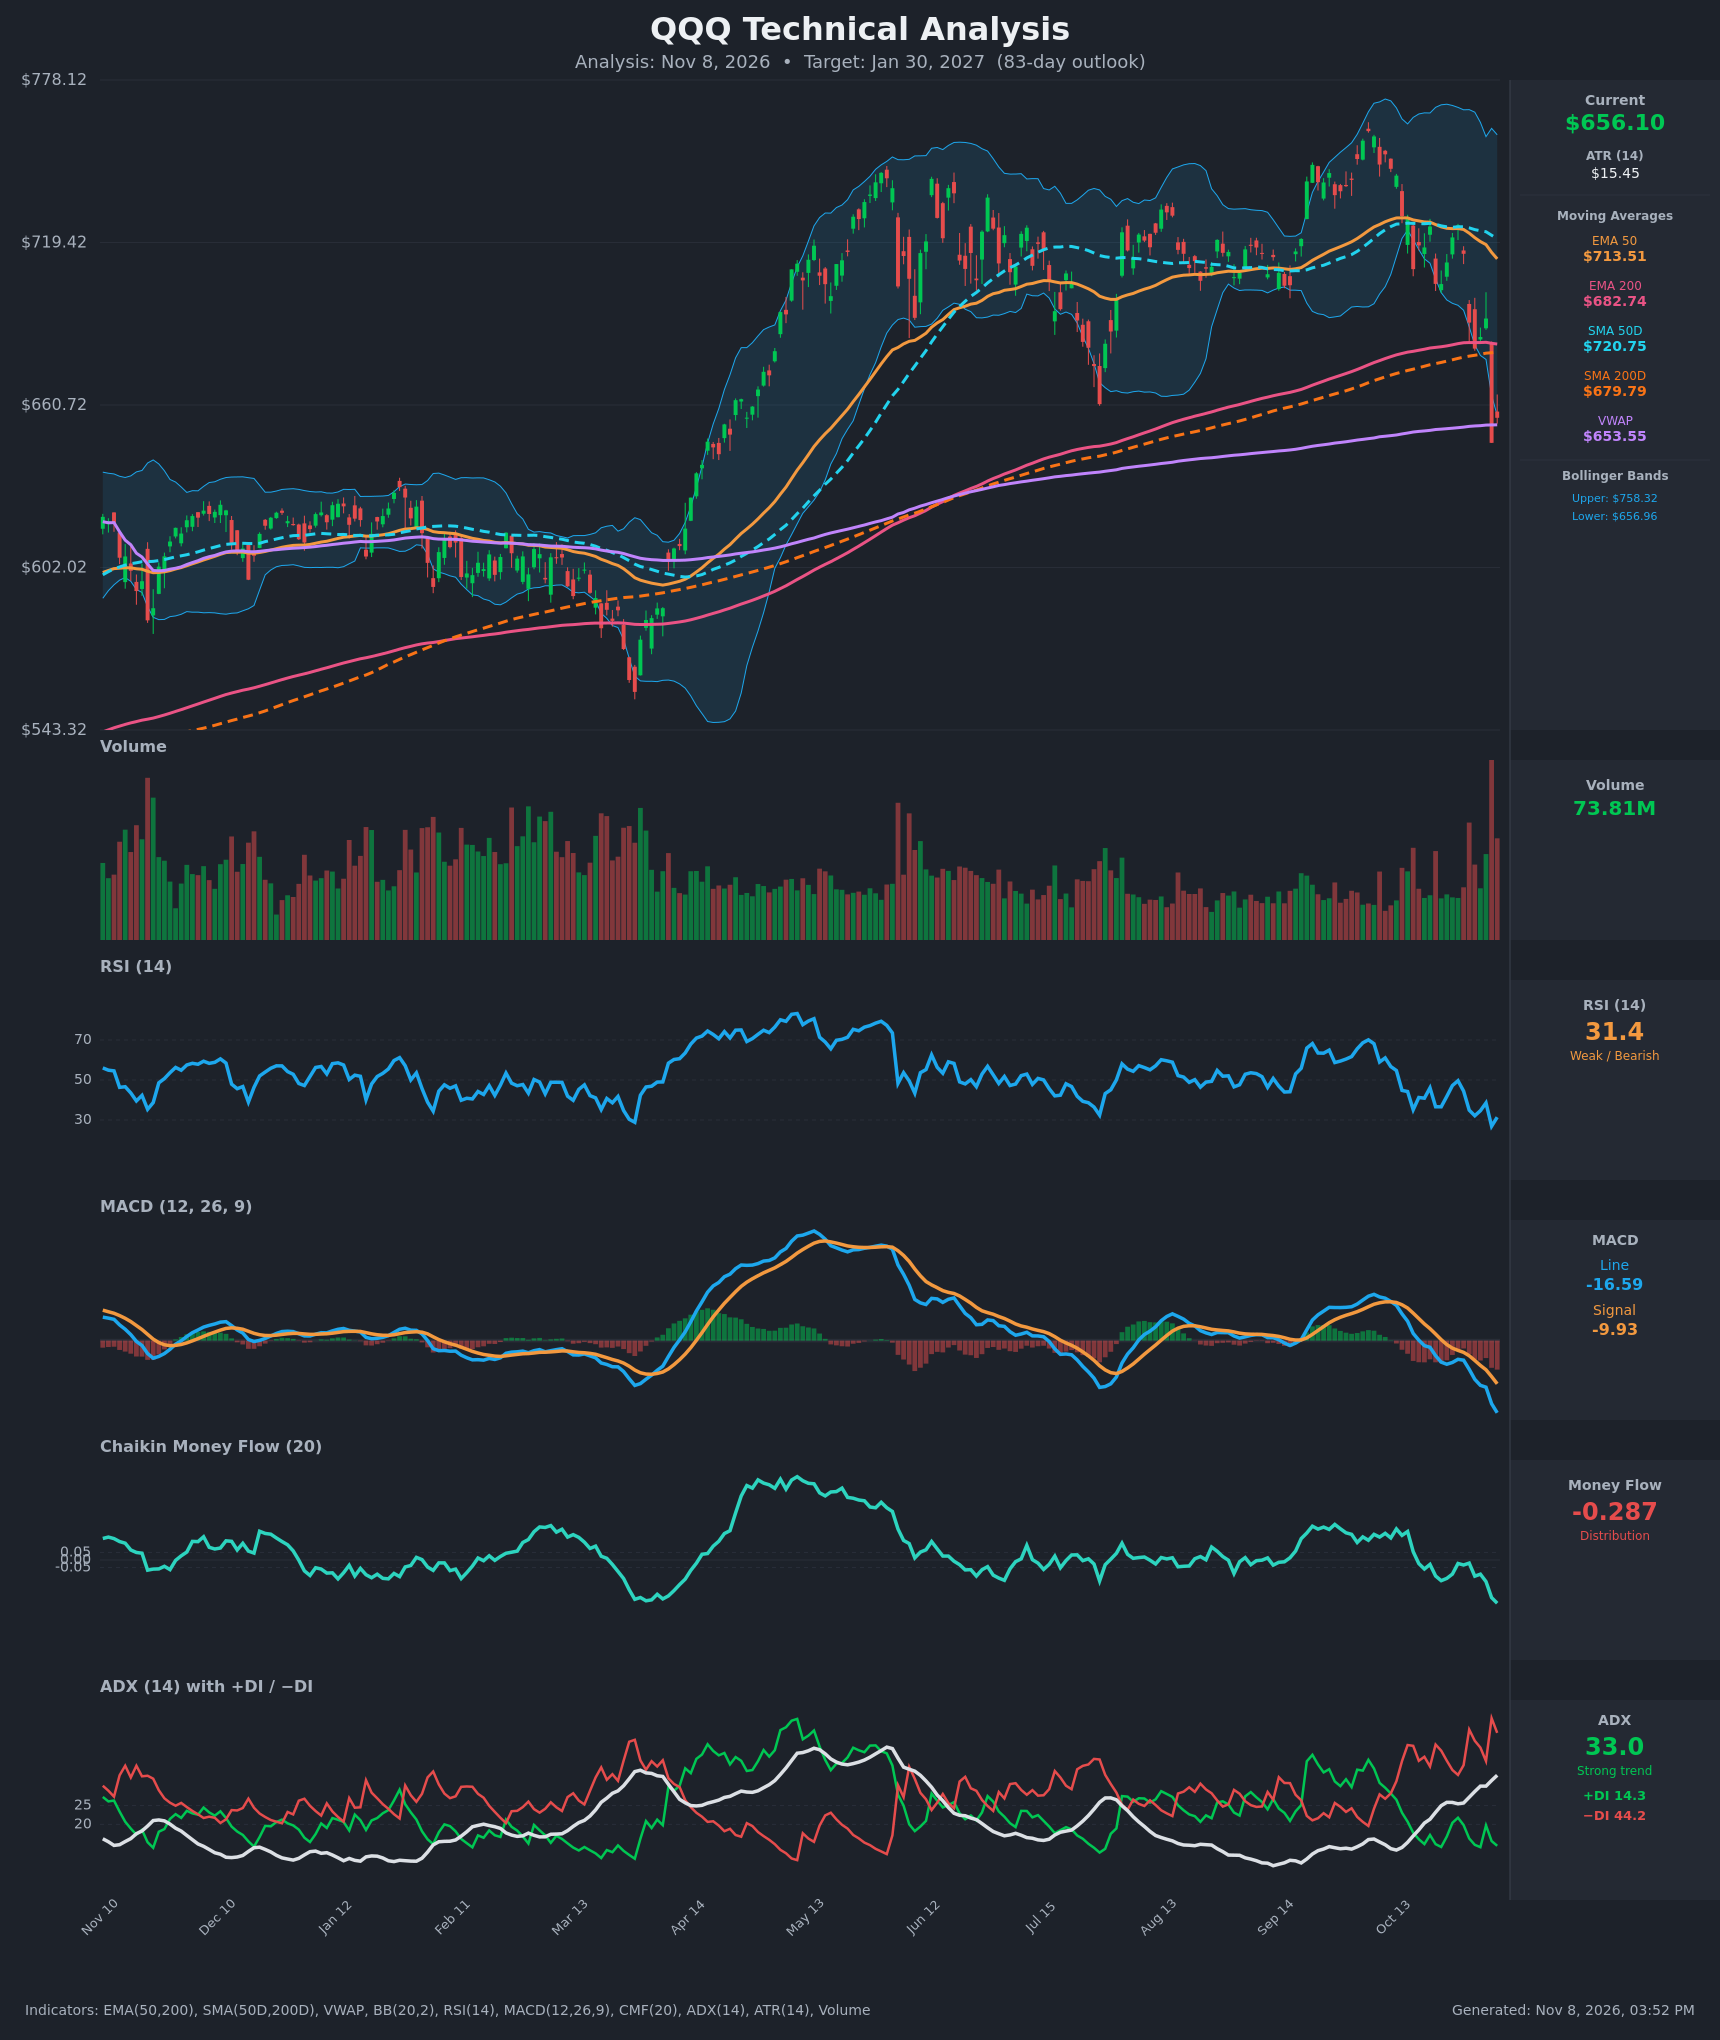
Analysis
TECHNICAL INDICATORS
- RSI (14): 31.4, just off the 26.9 low on Nov 5. It fell from about 50 in late October, so momentum is clearly weak. It is near oversold but has not yet shown a bullish divergence. [Bearish]
- 20 EMA: Not supplied. The EMA 50 ($713.51) is falling and sits about 8.7% above price, so price is well below its short and medium-term averages. The rally attempts to $725 failed at this zone. [Bearish]
- MACD: Line -16.59 is below Signal -9.93 and accelerating lower. The bearish crossover happened around Oct 26, and the gap widened from -4.7 to -6.7 in two sessions. The histogram is deeply negative and still expanding. [Bearish]
- Bollinger Bands (20): Price of $656.10 is at or slightly below the lower band ($656.96), against an upper band of $758.32. The bands are very wide, which reflects the recent volatility expansion. A close outside the lower band is a strong-trend signal and a short-term stretch, so a relief bounce is likely. A sustained walk down the band is the bearish case. [Bearish]
- CMF (20): -0.287, a multi-month low and far below -0.05. It has fallen steadily from about -0.02 in late October. There is heavy distribution, with no sign of accumulation. [Distribution]
- ADX (14): 33.0 and rising from 18.6 two weeks ago. −DI (44.2) is far above +DI (14.3). This is a strong, established downtrend with bears in full control. [Strong Trend - Bearish]
- Volume: 73.81M, with the largest bar of the chart on the Nov 5 gap-down (red) and heavy volume since. The spike on a breakdown through the 200-day averages shows real distribution. It could also be a partial capitulation, which would argue for a short-term bounce. [Bearish - high-volume breakdown]
Moving average context:
- Price ($656.10) is below the EMA 50, SMA 50D, EMA 200 ($682.74) and SMA 200D ($679.79), so the long-term uptrend has been broken.
- The SMA50D ($720.75) is still above the SMA200D, so there is no death cross yet. The gap is closing, and EMA 50 is falling toward EMA 200.
- Price is slightly above the VWAP ($653.55), which is the last support layer.
DIVERGENCES & TRENDS
- There is no bullish RSI divergence. RSI made a higher low (31.4 vs 26.9) only after a one-day bounce, and price made a lower low in the same window. Nothing here confirms a bottom.
- The MACD, CMF and ADX/DI readings all confirm the price decline, so there are no bearish divergences to flag either.
- The MACD bearish crossover is in force, and −DI has dominated +DI since late October.
- The price broke below the July swing low (~$660) and then below the 200-day averages, which is a decisive range break.
- The SMA50D/SMA200D gap is narrowing quickly, and a death cross is plausible within the 83-day window if the decline continues.
- RSI near 30 and price at the lower Bollinger Band make a relief rally likely, but oversold readings in a strong trend (ADX 33) often persist.
CHART PATTERNS
- Bearish Double/Triple Top into a range break: Peaks near $755-770 (May and Sep/Oct) over a floor near $660 (July low) resemble the Bearish Double Top. The close below that neckline is the confirmation. The measured move is the pattern height (~$100) projected down from $660, which gives about $560.
- Bearish Expanding Triangle / broadening top: The widening swings between $660 and $770 fit this reversal pattern, which also resolves downward.
- Caveat: A price already stretched below the lower band and 31 RSI often retests the broken level ($680-$683, the 200-day averages) before the next leg. The measured target of ~$560 is the extended bearish case, not the base case.
POTENTIAL SCENARIOS
- Scenario 1: Bearish Trend Continuation After Relief Bounce — The breakdown below the 200-day averages continues after a likely retest of $680-$683, with the death cross approaching. Trigger: rejection at the SMA200D/EMA200 zone, or a daily close below $647 (Nov 5 close). Target: $600-$630 first, with an extended measured-move target near $570. Invalidation: daily close above $715 (EMA 50). (50% probability)
- Scenario 2: Bullish Oversold Reversal / Reclaim — Capitulation volume marks a washout, RSI diverges, and price reclaims the 200-day averages as a failed breakdown. Trigger: close above $683, then above $713 (EMA 50). Target: $715-$740. Invalidation: close below $640 without a bounce. (35% probability)
- Scenario 3: Neutral Choppy Base — Price oscillates between VWAP/$647 support and the $680 resistance as indicators reset. Trigger: several closes between $647 and $683 with ADX falling below 25. Target: $640-$680 range. Invalidation: close outside that range on rising volume. (15% probability)
PRICE TARGETS
For the 83-day horizon, one ATR-scaled standard move (15.45 × √83 ≈ $141) supports a range of about 21% of the current price. The range here is $575.00 to $715.00, a width of $140 (21.3%), consistent with the 18-30% guidance for 61-180 days.
- Target Price: $632.00 (about 3.7% below current, on a bearish bias with a rebound-and-fade path)
- Expected Range: $575.00 to $715.00
- Key Levels: Support at $647.00 (Nov 5 close / just below VWAP at $653.55), Resistance at $680.00 (SMA200D, with EMA200 at $682.74 just above)
OVERALL BIAS
OVERALL BIAS: BEARISH - ADX 33 with −DI far above +DI, a MACD bearish crossover, CMF at -0.287 and a high-volume break below the 200-day averages and the $660 range floor all point lower. The oversold RSI and lower-band reading make a bounce toward $680 likely first, but the rally should struggle at the broken 200-day averages.
This is educational analysis and not financial advice.