SMCI 83-day bearish forecast — Nov 8, 2026
- Bias: Bearish
- Timeframe: 83 days (made Nov 8, 2026, target date Jan 29, 2027)
- Price at analysis: $28.76
- Price target: $26.20
- Expected range: $22.60 – $30.20
- Result: Pending — graded after the close on Jan 29, 2027
Get a free AI analysis of SMCI today
Analysis
TECHNICAL INDICATORS
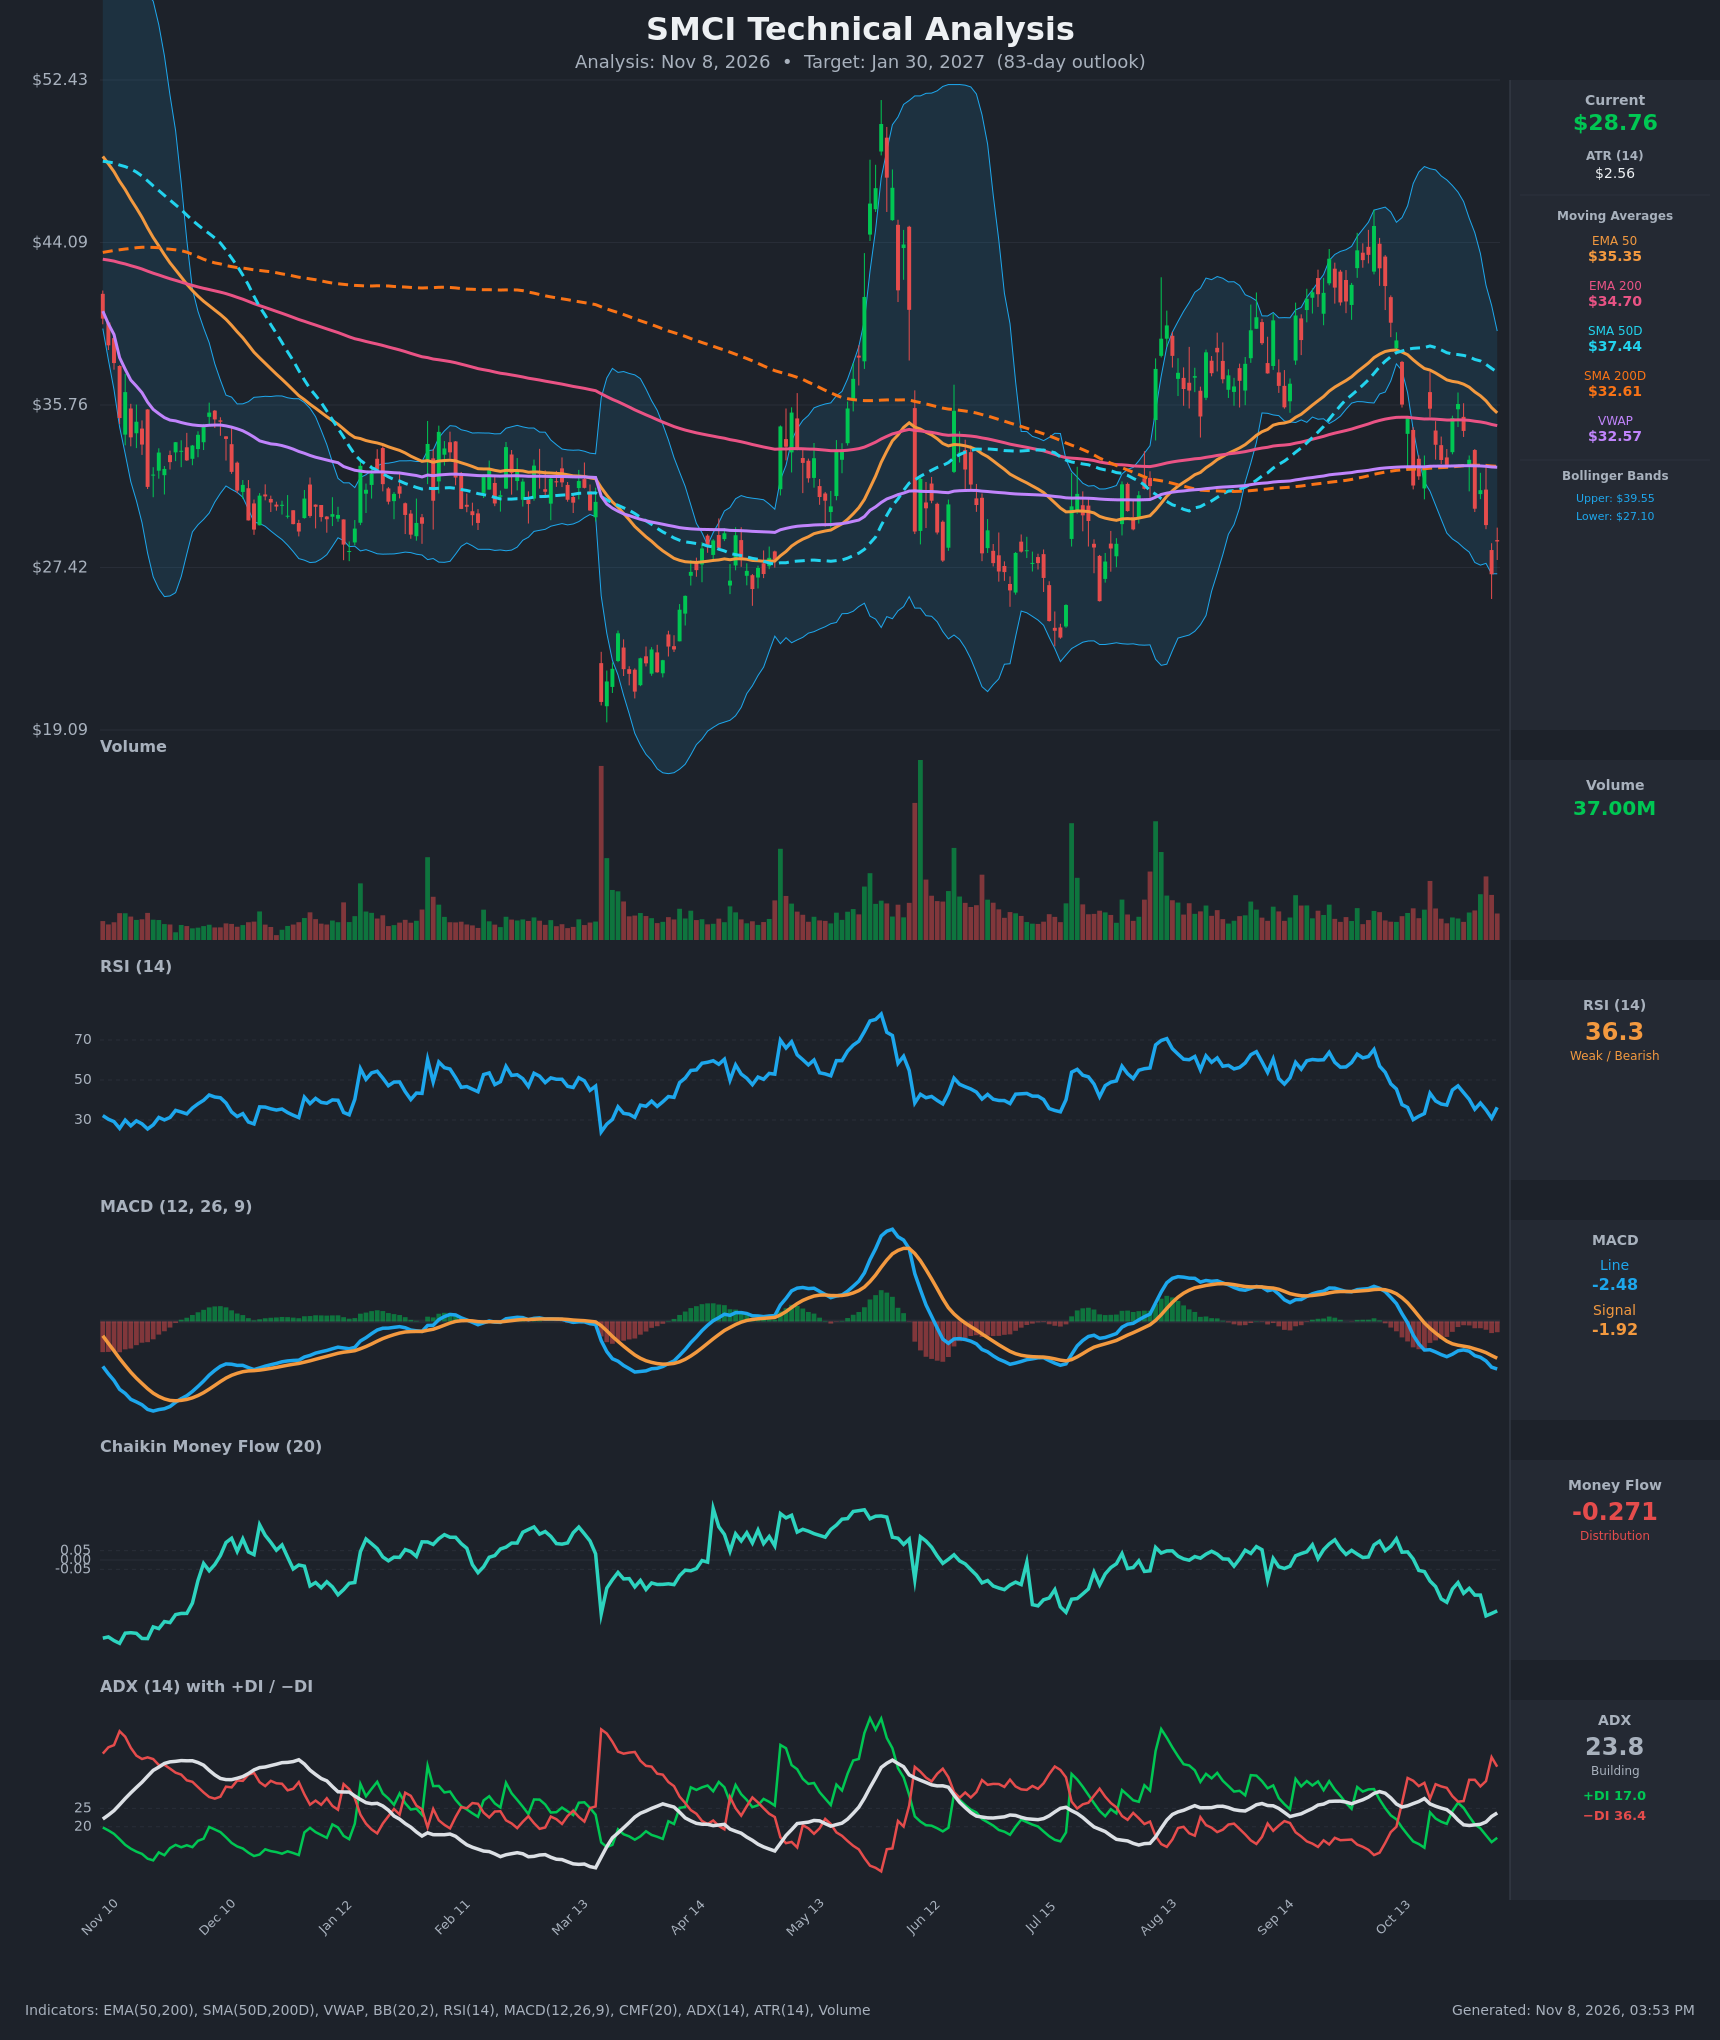
- RSI (14): 36.34, in the weak zone just above oversold. It bounced from 31.0 on Nov 5 but remains below 50, and every rally since October has failed under 47. Momentum is bearish with a possible oversold bounce. [Bearish]
- 20 EMA: Not provided. The EMA 50 ($35.35) is the nearest moving-average proxy. Price ($28.76) is about 19% below it and the EMA 50 is falling steadily, so it acts as heavy overhead resistance. [Bearish]
- MACD: Line -2.481 is below signal -1.920, and both are below zero. The histogram is about -0.56 and has widened for several sessions. The line made a new low on Nov 6, so there is no bullish crossover yet. [Bearish]
- Bollinger Bands (20): Upper $39.55, lower $27.11, midline about $33.3. Price is near the lower band (%B about 0.13) after a low of $27.08 on Nov 5. The bands are wide, which means high volatility. A hold at the lower band could give a mean-reversion bounce, but this is a downtrend "band walk" and not yet a reversal. [Bearish]
- CMF (20): -0.271, well below the -0.05 threshold. It has fallen steadily from about -0.06 on Oct 19 and is at the lowest level on the chart. This is persistent, heavy distribution. [Distribution]
- ADX (14): 23.8 and rising from 20.3 on Oct 30, close to the 25 trend threshold. −DI (36.4) is far above +DI (17.0), and the gap is widening. Sellers are firmly in control and the downtrend is gaining strength. [Building Trend – Bearish]
- Volume: 37.00M, elevated relative to the recent average, with heavy volume on the selloff days of Nov 4–5. The Nov 6 bounce came on strong volume from the $27 low, which could mark early capitulation or buying interest. It has not yet shown follow-through. [Selling pressure with possible capitulation]
DIVERGENCES & TRENDS
- MA structure: Price is below the EMA 50, EMA 200, SMA 50D, SMA 200D and VWAP ($32.57). This is a clear short-term breakdown below the long-term cluster at $32.6–$34.7.
- EMA convergence: The EMA 50 – EMA 200 gap has shrunk from about $2.8 (Oct 19) to $0.65 (Nov 6). An EMA death cross is likely within days to weeks. The SMA 50D ($37.44) is still well above the SMA 200D ($32.61), so there is no SMA death cross yet, but the SMA 50D is rolling over.
- MACD: The bearish crossover occurred around Oct 20 and the gap is widening. It is still at lows, which confirms momentum.
- DI: −DI has dominated since Oct 19 apart from a brief near-cross on Oct 28 (26.5 vs 26.9). The recent −DI spike to 39 shows renewed selling.
- Possible RSI divergence: Price made lower lows ($32.5 → $30.4 → $27.1) while RSI held around 31–35. This is a mild sign of selling exhaustion, but it is not confirmed.
- CMF: It is making new lows alongside price, so money flow confirms the decline with no divergence.
- Failed rally: The Sep–Oct high near $46 was a lower high than the May peak near $52, and price has since fallen about 40%.
CHART PATTERNS
- Bearish double-top / broad topping structure: Peaks near $52 (May) and $46 (Sep) are followed by a breakdown through the $30–$33 support base. This resembles the Bearish Double Top / Head and Shoulders family. The breakdown is confirmed by the loss of the SMA 200D and the VWAP.
- Bearish flag / pennant: The choppy bounces to $35.8 in late October, followed by lower highs, fit a bearish continuation structure. Resolution to the downside would extend toward $24–$26.
- Target logic: The topping structure implies a measured move well below $27, but the $27 area and the older $23–$24 lows (Jul–Aug) should provide strong support. The target is therefore set modestly below the current price at the base of the nearest support zone.
- The chart is not a clean textbook pattern. It is a lower-high, breakdown structure with a bearish continuation bias.
POTENTIAL SCENARIOS
- Scenario 1: Bearish Trend Continuation — Sellers (−DI 36 vs +DI 17) keep control, ADX pushes above 25, and the EMA 50/200 death cross completes. A failed bounce at the $30–$32.6 cluster leads to a break of the $27.08 low. Trigger: daily close below $27.00 on rising volume, or rejection at $31–$32.6. Target: $24.00–$25.50, with an extension to $22.50. Invalidation: daily close above $33 (VWAP/SMA 200D reclaimed). (50% probability)
- Scenario 2: Neutral Relief Bounce and Range — Oversold RSI and the lower-band hold produce a bounce to the $30–$32.6 resistance, then price chops sideways within $26–$32. Trigger: hold above $27.08 with MACD histogram contracting. Target: $29.50–$31.50. Invalidation: close below $26.50 (bearish) or above $33.50 (bullish). (30% probability)
- Scenario 3: Bullish Reversal — The Nov 6 bounce marks capitulation, and CMF recovers above -0.05. Price reclaims the VWAP and SMA 200D. Trigger: close above $32.60 with MACD bullish crossover. Target: $35.30–$37.40 (EMA 50 / SMA 50D). Invalidation: close back below $28 after the breakout attempt. (20% probability)
PRICE TARGETS
- Target Price: $26.20 (83-day horizon, about Jan 30, 2027)
- Expected Range: $22.60 to $30.20 (width $7.60, about 26.4% of the current price, consistent with the 61–180 day guidance)
- Key Levels: Support at $27.08 (recent swing low / lower Bollinger Band), with deeper support near $24.00. Resistance at $32.60 (VWAP / SMA 200D cluster).
OVERALL BIAS
OVERALL BIAS: BEARISH - Price sits below all major moving averages and VWAP. MACD is below signal and zero, −DI (36.4) dominates +DI (17.0) with ADX rising, and CMF at -0.271 shows heavy distribution. The oversold bounce from $27.08 is the main risk, but it needs a reclaim of $32.60 to change the picture.
This is educational analysis and not financial advice.