WMT 83-day bullish forecast — Nov 8, 2026
- Bias: Bullish
- Timeframe: 83 days (made Nov 8, 2026, target date Jan 29, 2027)
- Price at analysis: $125.52
- Price target: $128.50
- Expected range: $111.00 – $136.00
- Result: Pending — graded after the close on Jan 29, 2027
Get a free AI analysis of WMT today
Analysis
TECHNICAL INDICATORS
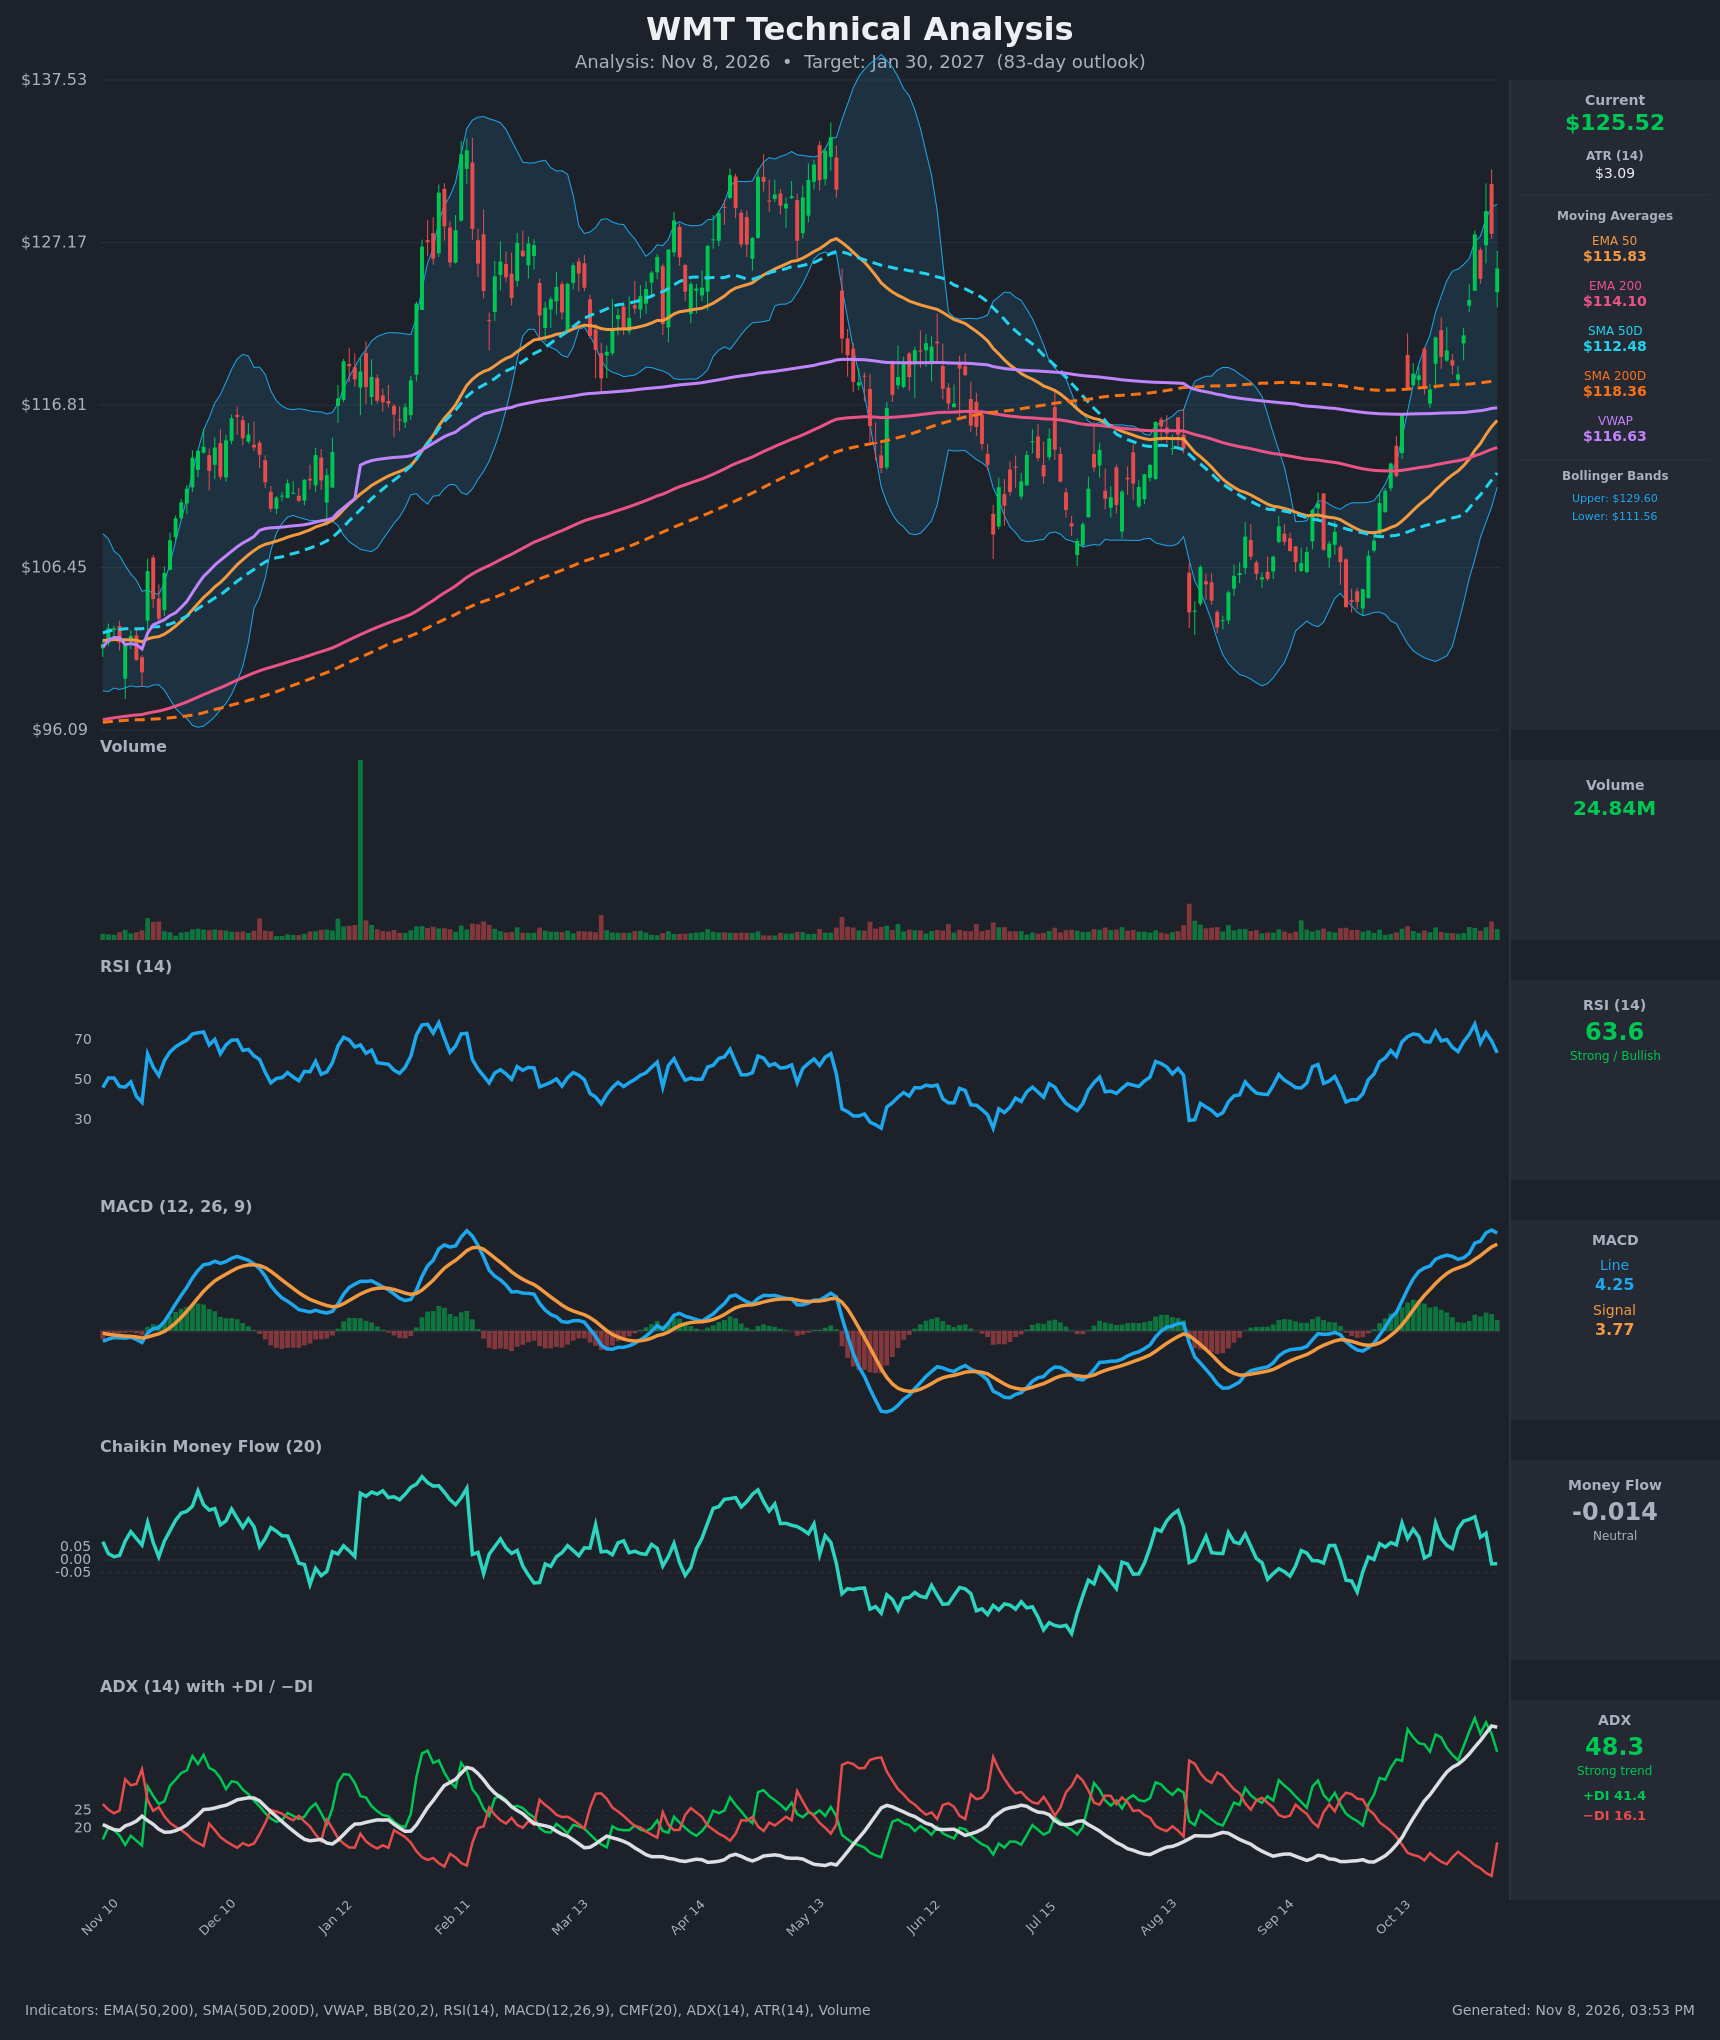
- RSI (14): 63.59, down from the 77.9 peak on Nov 2 and cooling from overbought. It remains in bullish territory (above 50), but the peaks have been lower (77.9 → 73.7 → 63.6), so momentum is fading in the short term. [Bullish]
- 20 EMA: Not supplied directly. The EMA50 is $115.83 and price at $125.52 is about 8% above it. Price is well extended above the short-term trend and the EMA50 (about $115.83) is rising steeply, so pullbacks toward the EMA20 or EMA50 would likely find support. [Bullish]
- MACD: Line 4.25 is above Signal 3.77, so the bullish crossover is intact and both lines are positive. The line peaked at 4.382 on Nov 5 and has started to roll over (4.251), so the histogram (+0.48) is narrowing from its recent high. This is an early sign of momentum fatigue, not a sell signal. [Bullish]
- Bollinger Bands (20): Upper $129.60, lower $111.56, midline about $120.58. Price at $125.52 sits in the upper third, after touching or breaching the upper band on Nov 4 ($129.17). The bands are wide (about $18) after the expansion, which signals strong momentum and also high volatility. A walk along the upper band is typical of strong trends, though a reversion toward the midline is common. [Bullish]
- CMF (20): -0.014, in the neutral zone. It fell from +0.168 on Nov 2 to slightly negative, so buying pressure has faded despite the rally. This is a mild warning that the push to $129 lacked sustained accumulation. [Neutral]
- ADX (14): 48.3 with +DI 41.4 and −DI 16.1. This is a very strong trend, and +DI is clearly on top. ADX at this level is often near trend exhaustion and favors consolidation or a pullback. ADX did tick down slightly from 48.6, and −DI jumped from 6.7 to 16.1 on the red candle. [Strong Trend – Bullish, possibly mature]
- Volume: 24.84M on the latest bar, elevated against the typical baseline, with the heavier volume on the recent sharp advance. The latest reversal candles (Nov 3, Nov 5, Nov 6) show selling pressure at the highs. [Neutral to mildly bullish]
DIVERGENCES & TRENDS
- Mild bearish momentum divergence: Price made a high at $129.17 on Nov 4, while RSI (73.7) was below its Nov 2 peak (77.9). The MACD line peaked on Nov 5 and is now rolling over. CMF has fallen from +0.17 to slightly negative while price stayed near highs.
- Moving average structure: EMA50 ($115.83) crossed above EMA200 ($114.10) around Nov 2, a fresh bullish EMA cross. The SMA50D ($112.48) is still below the SMA200D ($118.36), so there is no golden cross yet, and the gap is narrowing (about $5.9). Price sits above both, a bullish reclaim of the long-term average.
- VWAP: Price is about $8.90 above VWAP ($116.63), a strong buying bias that is also stretched.
- Trend: The advance from roughly $104 in September/October to $129 is a vertical move of about 24% in about 5 weeks. A pullback or consolidation is common after such moves, and the last three candles show rejection near $129.
- Prior ceiling: The chart shows previous highs around $130-$133 (May) and a peak near $137.5. This zone is major overhead resistance.
CHART PATTERNS
- Bullish flag / pennant (continuation) potential: After the sharp vertical rally (the pole), a short consolidation between roughly $123 and $129 is forming. A break above $129.60 would project a measured move of about $24 × partial extension, toward $133-$137, retesting the prior highs.
- Possible short-term double top (reversal) risk: Highs at $127.69 (Nov 2) and $129.17 (Nov 4) with a trough at $124.86. A break below $124.86 and then $123.5 would suggest a pullback toward the $120 midline and the EMA50 near $116. The pattern is not confirmed, so treat it as a risk.
- Larger structure: The chart shows a prior range from about $104 to $137 over the year. The current rally is a recovery toward the upper part of that range, with major resistance at $130-$137.
POTENTIAL SCENARIOS
- Scenario 1: Bullish Trend Continuation After Consolidation — The strong ADX and +DI dominance, price above all key MAs, and the EMA50/EMA200 bullish cross support a consolidation (flag) followed by another leg higher. The SMA50 is likely to approach a golden cross within the window. Trigger: a daily close above $129.60 (upper band and recent high) on rising volume. Target: $134-$136, near the prior resistance zone. Invalidation: a close below $118 (below the SMA200 and the breakout area). (45% probability)
- Scenario 2: Bearish Pullback / Mean Reversion — The momentum fade (RSI and MACD peaking, CMF neutral, large rejection wicks) and the extension 8% above the EMA50 and $8.90 above VWAP suggest the rally is overextended. A retracement toward the rising EMA50, SMA200 and VWAP cluster ($115-$118) is typical before the next move. Trigger: a close below $124.86, then $120.5 (the Bollinger midline). Target: $116-$119. Invalidation: a reclaim of $129.60 on strong volume. (35% probability)
- Scenario 3: Neutral Range Consolidation — Price digests the gains between about $118 and $130 for most of the period and ends near the current level as ADX cools. Trigger: failure to break either $129.60 or $118. Target: $122-$128. Invalidation: a break outside the range. (20% probability)
PRICE TARGETS
For an 83-day horizon (range width guidance 18-30%), the trend and moving-average structure are bullish, but the extension limits the upside. I take a modestly bullish stance, with the target slightly above current price after a likely digestion period.
- Target Price: $128.50 (83 days)
- Expected Range: $111.00 to $136.00 (width $25.00 = about 19.9% of current price, consistent with the 61-180 day guidance)
- Key Levels: Support at $118.36 (SMA200D, with the EMA50 at $115.83 beneath it), Resistance at $129.60 (upper Bollinger Band and recent high; major resistance above at $133-$137)
OVERALL BIAS
OVERALL BIAS: BULLISH - The trend is strong (ADX 48.3, +DI 41.4 vs −DI 16.1), price is above every major moving average, and the bullish EMA50/EMA200 cross has formed with MACD positive. Near-term overextension and fading momentum point to a pullback or consolidation first, but I expect higher levels over 83 days, in the $128-$136 region.
This is educational analysis and not financial advice.