TSLA 83-day bearish forecast — Nov 8, 2026
- Bias: Bearish
- Timeframe: 83 days (made Nov 8, 2026, target date Jan 29, 2027)
- Price at analysis: $358.22
- Price target: $340.00
- Expected range: $305.00 – $385.00
- Result: Pending — graded after the close on Jan 29, 2027
Get a free AI analysis of TSLA today
Analysis
TECHNICAL INDICATORS
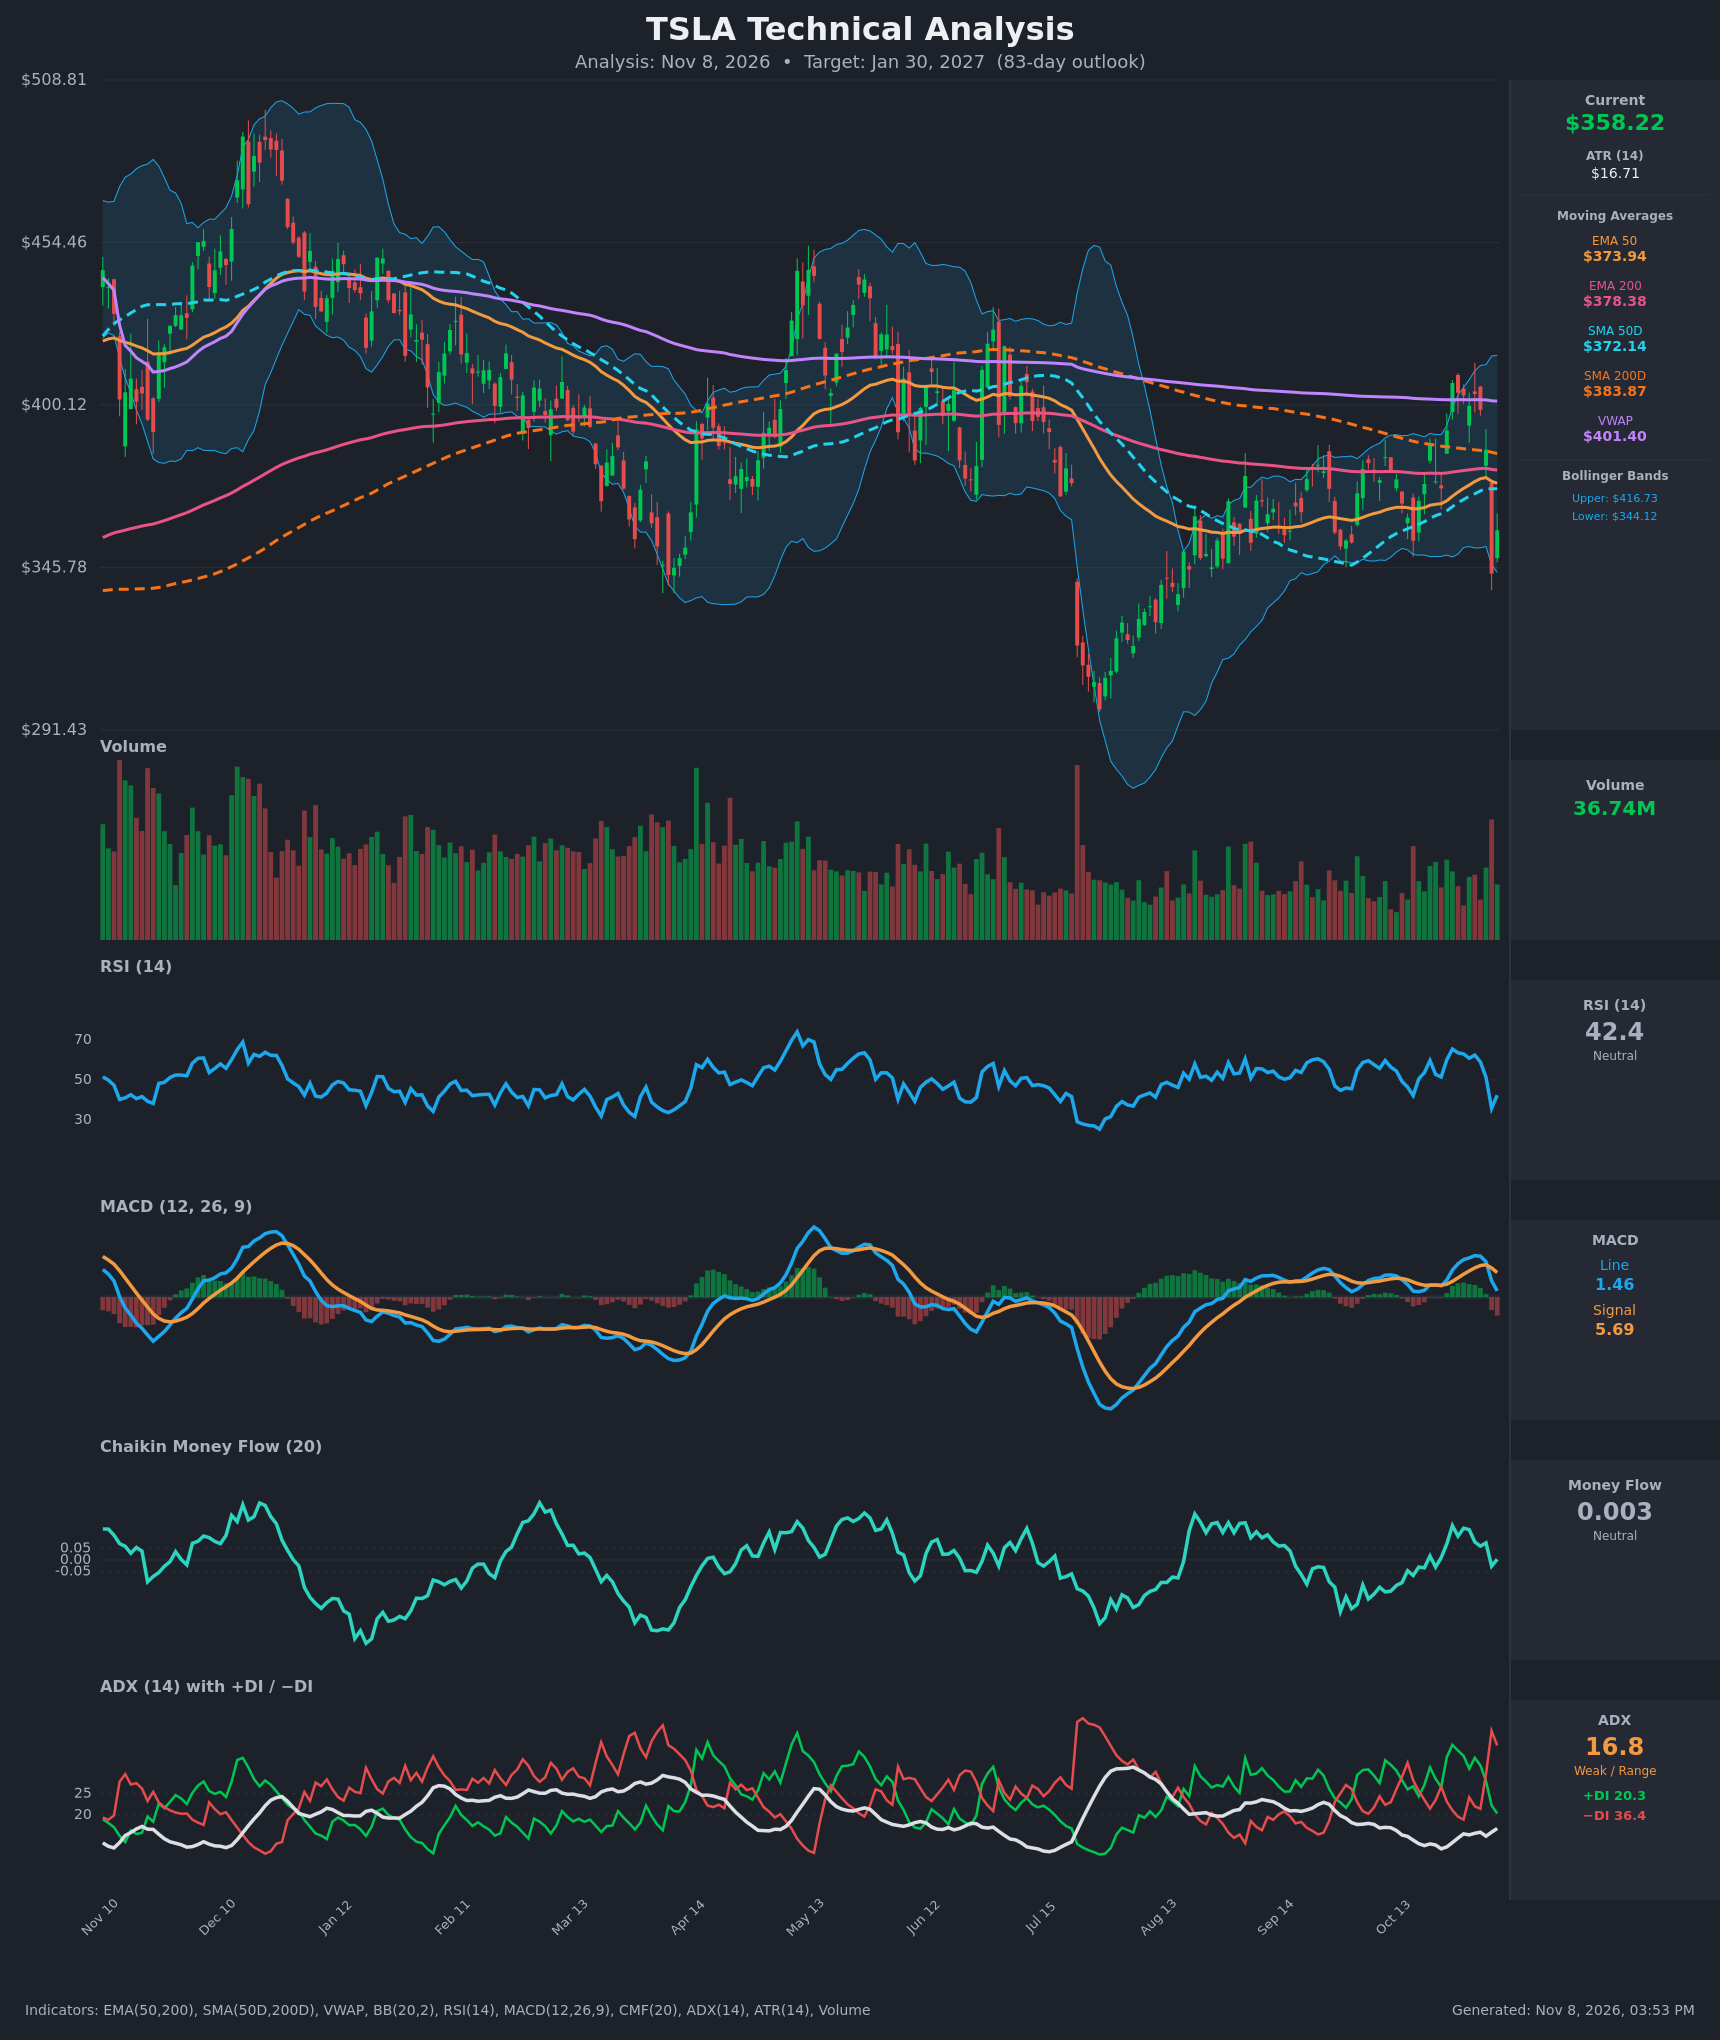
- RSI (14): 42.39, down from 62.5 on Nov 2 and a low of 35.8 on Nov 5. It is below the 50 midline but not oversold. The Nov 6 bounce is small, and momentum is still tilted down. [Bearish]
- 20 EMA: No 20 EMA value was supplied, so I use the EMA 50 ($373.94) as the nearest dynamic reference. Price at $358.22 is below the EMA 50 ($373.94), the EMA 200 ($378.38) and the SMA 50D ($372.14), so that cluster of $372–$378 is overhead resistance. [Bearish]
- MACD: The line (1.46) crossed below the signal (5.69) on Nov 5, and the gap widened on Nov 6. The histogram is negative (about -4.2) and the line is falling toward zero. A move below zero would confirm bearish momentum. [Bearish]
- Bollinger Bands (20): Upper $416.73, lower $344.12, midline about $380.4. Price is in the lower third of the band after rejection from the upper band near $407. The Nov 5 low (about $343.7) touched the lower band, which is a reaction zone. The bands are moderately wide, so volatility is elevated but not extreme. [Neutral]
- CMF (20): 0.003, inside the ±0.05 neutral zone. It fell from +0.149 on Oct 27 to about zero, so the late-October accumulation has faded. There is no real buying pressure behind the bounce. [Neutral]
- ADX (14): 16.8, a weak trend, though slightly rising from 15.0. −DI (36.4) is well above +DI (20.3), after a bearish DI flip on Nov 4. Sellers are in control, but without trend strength. [Weak Trend, Bearish Direction]
- Volume: 36.74M on the latest bar. The Nov 5 breakdown candle (-10.8%) came on a heavy-volume red bar, which signals real distribution. The bounce volume is lower, so it looks like a relief bounce rather than a reversal. [Bearish Bias]
DIVERGENCES & TRENDS
- There is no clear bullish or bearish divergence. The Oct 27 high ($407) came with an RSI of 65.5 and a MACD of 6.25, and the later retest ($403.8 on Nov 2) had a higher MACD (9.59) but a lower RSI (62.5). That is mixed rather than a clean divergence.
- MA structure: The SMA 50D (372.14) is below the SMA 200D (383.87), a death cross that has been in place for months. The EMA 50 is below the EMA 200 (373.94 vs 378.38). The gap narrowed in late October but is now widening again, so the bounce toward the EMA 200 failed.
- Price vs VWAP: Price is far below VWAP ($401.40), which has acted as a ceiling all year.
- Bearish crosses: The MACD crossed down on Nov 5 and the DI flip on Nov 4 favours sellers. The last two bars' ADX uptick suggests the new move down may be gaining some strength.
- Rally failure: The rally from the July low (~$300) stalled at the $407 area, just under VWAP and the SMA 200D.
CHART PATTERNS
- Bearish Double Top (Reversal): The peaks are at $407.46 (Oct 27) and $403.82 (Nov 2), with a neckline around $372–$385, broken on Nov 5 on heavy volume. The measured move is about $35, projecting to roughly $337 (an approximate target from the break).
- Broader context: The bigger picture is a series of lower highs from about $490 (Dec) to $455 (May) to about $407 (Oct). That is a descending, range-bound structure with support at $343–$345 and the July low near $300. A break of $343 would open a move toward $320 and then $300.
- Counter-pattern: The Sep–Oct base around $345–$375 could be read as a triple-bottom-style range. It is not decisive, since the double top breakdown has already pushed price back to the base's lower edge.
POTENTIAL SCENARIOS
- Scenario 1: Bearish Double Top Follow-Through — Price fails to reclaim the $372–$378 MA cluster and breaks the $343–$345 support (lower BB / Nov 5 low), continuing the measured move toward the $300–$337 area. Trigger: daily close below $343.69 or rejection at $373.94. Target: $337, extending to $305–$320. Invalidation: daily close above $380 (EMA 200) with MACD reclaiming its signal line. (50% probability)
- Scenario 2: Neutral Range Chop — Price oscillates between the $343 floor and a $375–$385 ceiling, as the weak ADX (16.8) and flat CMF suggest, with MAs converging. Trigger: no daily close beyond $343 or $385. Target: $345–$380 range. Invalidation: close outside that range on rising volume. (25% probability)
- Scenario 3: Bullish Recovery — The Nov 5 flush is a bear trap at the lower Bollinger Band. Price reclaims the EMA 50/EMA 200 cluster and the SMA 200D, then retests the $400–$407 area (VWAP at $401). Trigger: close above $384 with CMF above +0.05 and a MACD cross up. Target: $400–$407. Invalidation: close below $343. (25% probability)
PRICE TARGETS
- Target Price: $340.00 (83-day horizon)
- Expected Range: $305.00 to $385.00. The width is $80, or about 22.3% of the current price, which fits the 61–180 day guidance of 18–30%.
- Key Levels: Support at $343.69, Resistance at $373.94
OVERALL BIAS
OVERALL BIAS: BEARISH - Price broke down from a double top on heavy volume. It sits below the EMA 50, EMA 200, SMA 50D, SMA 200D and VWAP. The MACD has crossed down and −DI (36.4) is well above +DI (20.3). The weak ADX and neutral CMF limit conviction, so the move is likely a grind toward and possibly through the $343 support.
This is educational analysis and not financial advice.