TQQQ 83-day bullish forecast — Nov 8, 2026
- Bias: Bullish
- Timeframe: 83 days (made Nov 8, 2026, target date Jan 29, 2027)
- Price at analysis: $52.25
- Price target: $57.50
- Expected range: $47.00 – $62.00
- Result: Pending — graded after the close on Jan 29, 2027
Get a free AI analysis of TQQQ today
Analysis
TECHNICAL INDICATORS
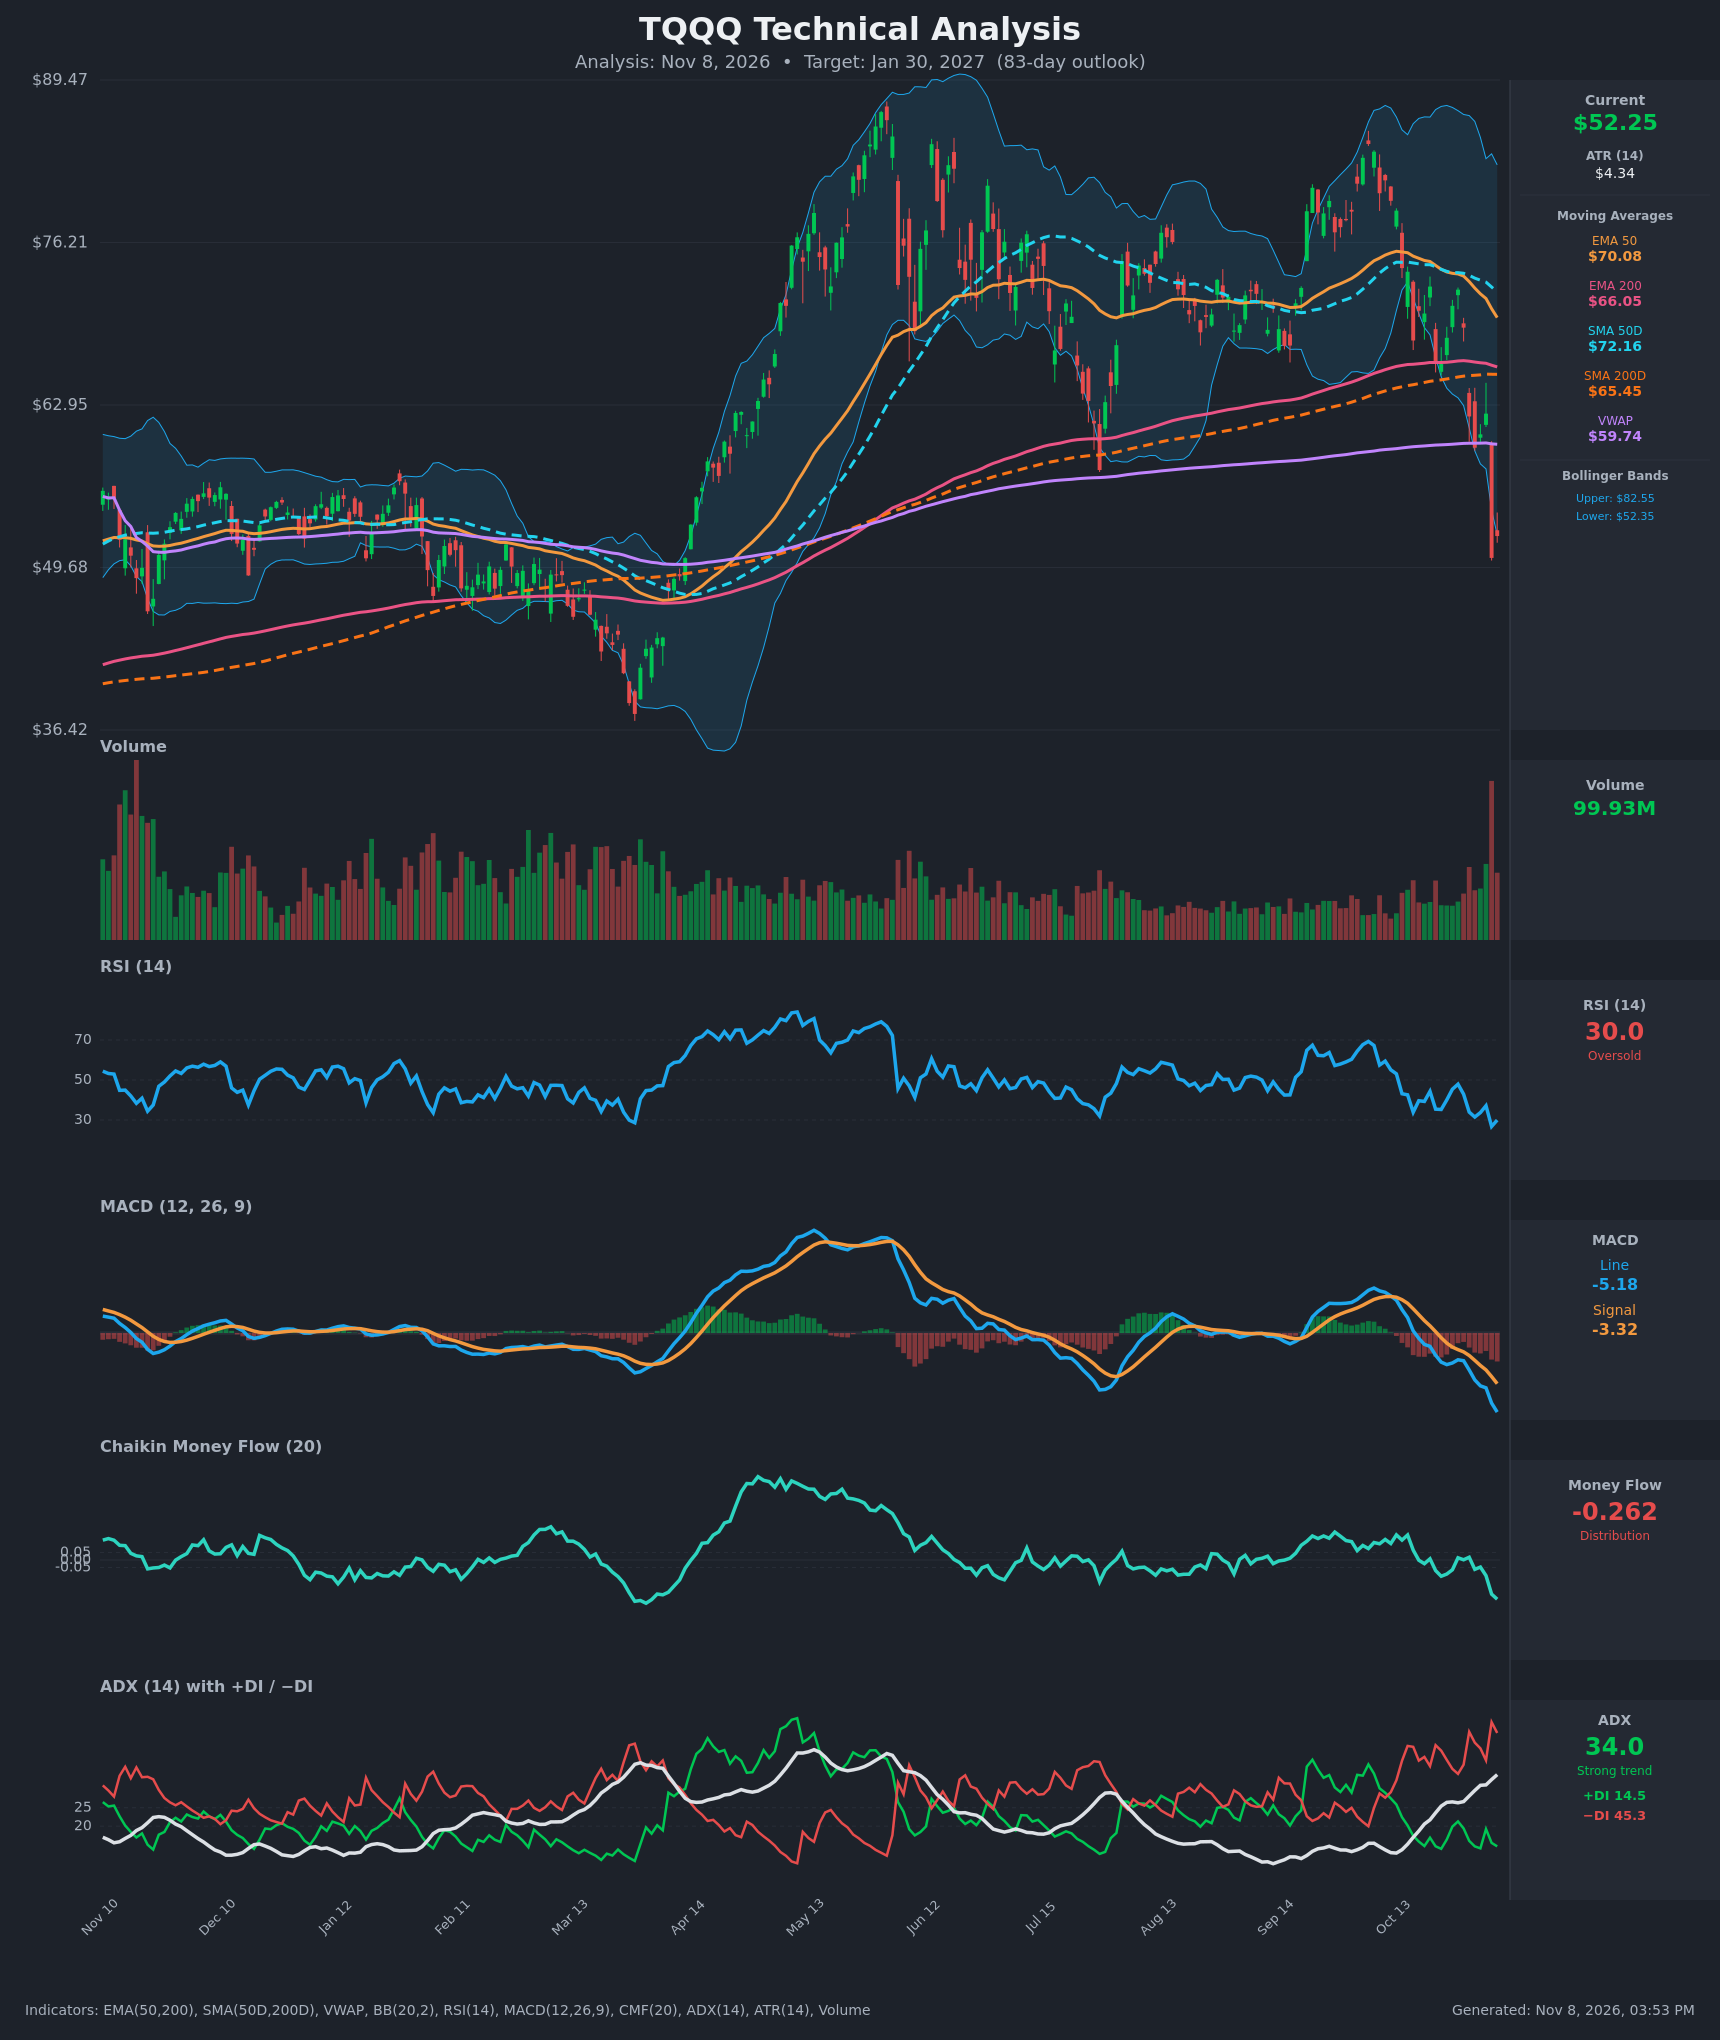
- RSI (14): 29.96, back at the oversold line after a low of 26.8 on Nov 5. It fell from ~48 on Oct 28 to 30, so momentum is still down, but the reading is stretched enough that a relief bounce is plausible. [Bearish (oversold)]
- 20 EMA: No 20 EMA was supplied, so I used the EMA 50 ($70.08) as the short-term proxy. Price is about 25% below it and below the EMA 200 ($66.05). Both averages are sloping down or flattening and act as heavy overhead resistance. [Bearish]
- MACD: Line -5.18 is below signal -3.32, and the histogram is increasingly negative. The bearish cross happened around Oct 22-23, and the gap keeps widening, with no sign of a turn yet. [Bearish]
- Bollinger Bands (20): Price of $52.25 sits on the lower band ($52.35), well below the midline, with the upper band at $82.55. The bands are very wide because of the recent volatility. Riding the lower band shows strong downside momentum, but it is also a stretched, mean-reversion-prone condition. [Bearish]
- CMF (20): -0.262, deeply negative and falling from near zero a week ago. This is heavy distribution, though it is approaching the extremes seen at the March low. [Distribution]
- ADX (14): 34.0 and rising, with -DI at 45.3 far above +DI at 14.5. This is a strong, established downtrend with bears firmly in control. [Strong Trend – Bearish]
- Volume: 99.93M, the largest spike on the chart, on a big red gap-down candle (Nov 5, $62.24 → $50.47). Volume of this size often marks capitulation and a possible short-term low, but it also confirms aggressive selling. [Capitulation / Bearish with bounce potential]
DIVERGENCES & TRENDS
- There is no bullish RSI or MACD divergence yet. Both made new lows with price, so the downtrend is intact.
- RSI went from 26.8 to 30.0 while price made a marginal low at $50.47 and bounced to $52.25. This is an early oversold bounce, not a reversal signal.
- MACD is accelerating downward (-0.35 → -5.18 in 15 bars), and the histogram is expanding on the bearish side.
- ADX has risen from 18.7 to 34.0 with -DI dominant, so trend strength has increased as price fell.
- Price broke below the EMA 200 ($66.05), SMA 200D ($65.45) and VWAP ($59.74) in one move, with a gap. That is a significant structural break of the 6-month base of support.
- SMA50D ($72.16) is still above SMA200D ($65.45), so there is no death cross yet, but the gap is narrowing quickly (SMA50D has fallen from $74.47 to $72.16).
- CMF has been sliding since late October, which confirms distribution.
CHART PATTERNS
- Rough Bearish Triple Top: Peaks near $85-88 in May, June and October, with support around $62-66. The break below that support, on huge volume, resembles the Bearish Triple Top breakdown. The measured move (~$22 height) points to the high-$30s to low-$40s. That is the longer-term downside risk, and it lines up with the March low region.
- Rectangle consolidation breakdown: The $66-$75 range from July to October broke to the downside via a gap.
- Support zone: The $49-$50 area has been tested twice (the Nov 5 low at $50.47 and the Feb-Mar consolidation). A hold there could produce a Bullish Double Bottom style relief rally toward the gap and the 200-day averages ($62-$66).
- No clean bullish reversal pattern has formed yet, so any bullish case rests on mean reversion rather than pattern confirmation.
POTENTIAL SCENARIOS
- Scenario 1: Bullish Oversold Relief Rally — Capitulation volume, RSI near 30 and a close at the lower Bollinger Band lead to a multi-week bounce. Price fills part of the gap and retests VWAP and the broken support area. Trigger: Hold above $50.47 and a daily close above $56-$57, with the MACD histogram starting to shrink. Target: $57.50 in the base case, extending to $59.74 (VWAP) and $62-$65 (gap fill / 200-day averages). Invalidation: Daily close below $49.50. (45% probability)
- Scenario 2: Bearish Trend Continuation — ADX is rising with -DI dominant, so the sell-off keeps going after a weak bounce fails at the $56-$60 area. Trigger: Break below $50.47 / $49.68. Target: $44-$46, with the triple-top measured move at $38-$40 as the extreme. Invalidation: Daily close above $60. (40% probability)
- Scenario 3: Neutral Basing Range — Price chops between $48 and $58 as volatility compresses after the spike. Trigger: Sideways price action with RSI between 35 and 50. Target: $50-$56. Invalidation: Close outside $47-$60. (15% probability)
PRICE TARGETS
- Target Price: $57.50 (83 days, Jan 30, 2027)
- Expected Range: $47.00 to $62.00 (width $15.00, about 28.7% of the current price, consistent with the 61-180 day guidance of 18-30%)
- Key Levels: Support at $50.47, Resistance at $59.74
OVERALL BIAS
OVERALL BIAS: BULLISH - Modestly so. The trend indicators (ADX/−DI, MACD, CMF) remain bearish, but over an 83-day horizon the combination of capitulation-level volume, RSI at 30 and price on the lower Bollinger Band favors a mean-reversion bounce toward $57-$60 over continued decline. Conviction is limited, and a close below $49.50 would flip the view to bearish.
This is educational analysis and not financial advice.