TLT 83-day bullish forecast — Nov 8, 2026
- Bias: Bullish
- Timeframe: 83 days (made Nov 8, 2026, target date Jan 29, 2027)
- Price at analysis: $81.92
- Price target: $83.50
- Expected range: $75.50 – $90.50
- Result: Pending — graded after the close on Jan 29, 2027
Get a free AI analysis of TLT today
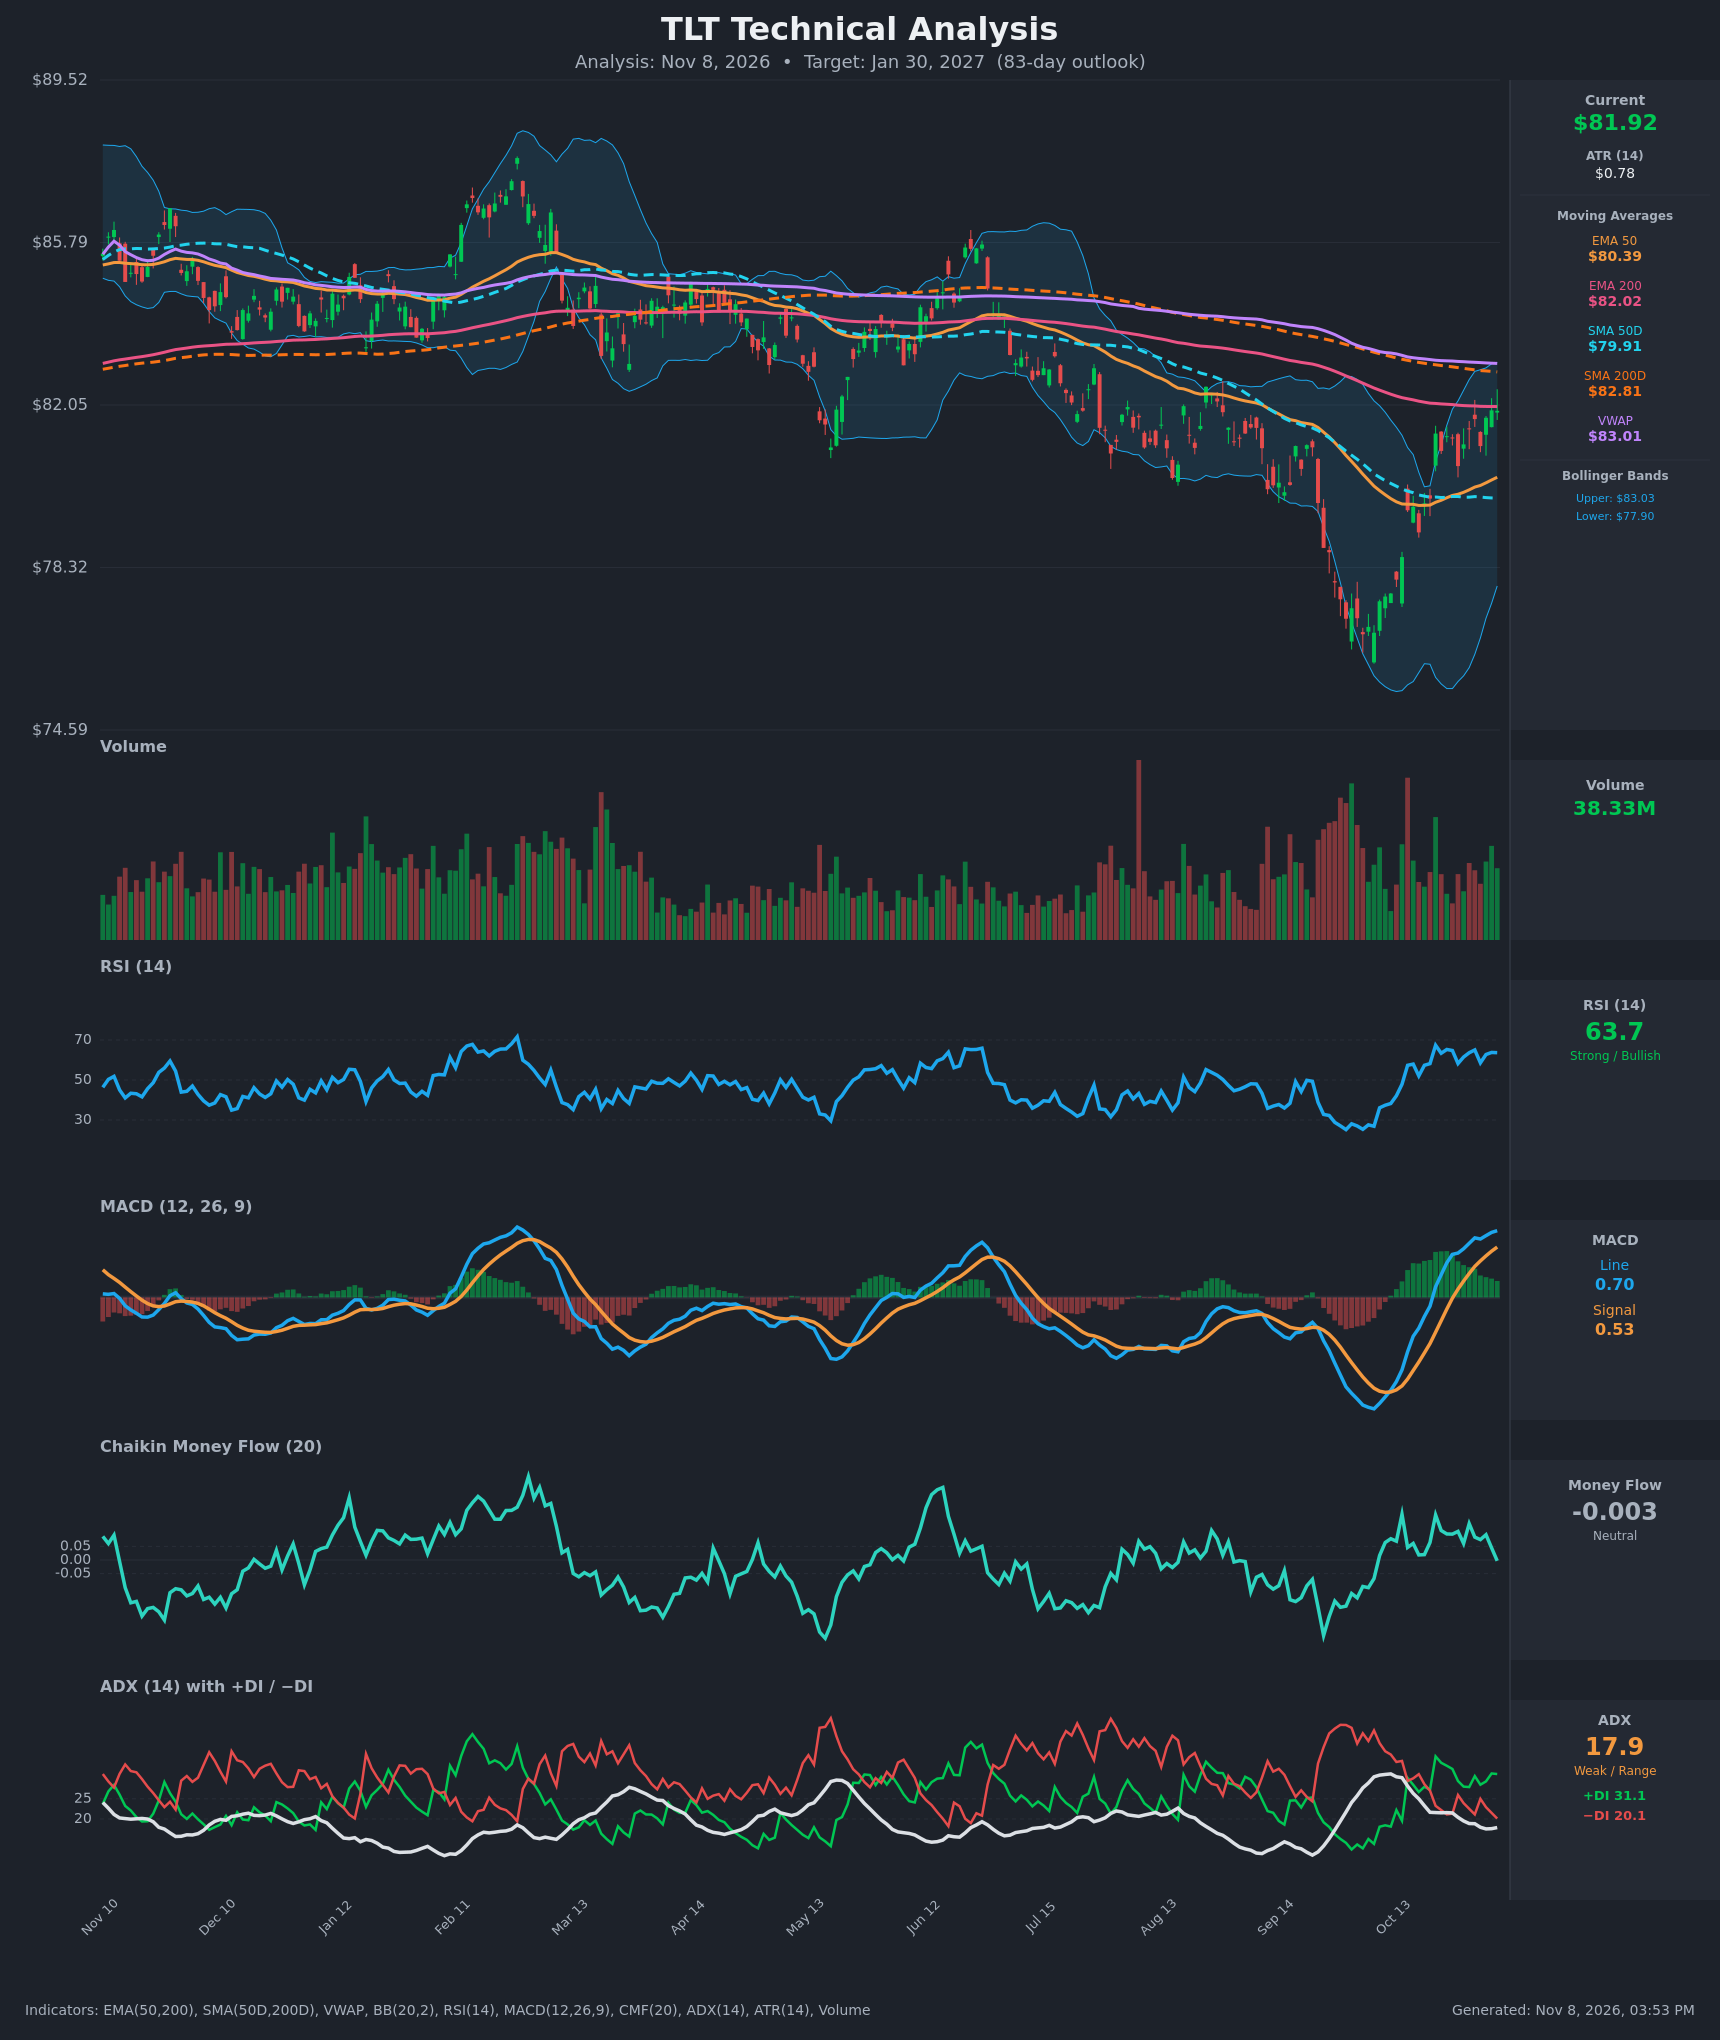
Analysis
TECHNICAL INDICATORS
- RSI (14): 63.66, up from the low-50s on Oct 19 and holding in the 58-67 band for three weeks. It is strong but below 70, so there is still room before overbought. [Bullish]
- 20 EMA: The 20 EMA isn't supplied, so I'm using the EMA 50 at $80.39 as the nearest trend proxy. Price ($81.92) is above it and the EMA is rising, which makes it near-term support. Price is still marginally below the EMA 200 ($82.02). [Bullish]
- MACD: Line 0.702 is above signal 0.529. The bullish cross came around Oct 22, and the line is still widening above the signal, with a positive, rising histogram. The line is above zero after the deep Sept-Oct trough. [Bullish]
- Bollinger Bands (20): Upper $83.03, lower $77.90, so the midline is about $80.46. Price is in the upper half of the bands after riding the midline up from the lower band. The bands are narrow relative to the October expansion. The upper band at $83.03 lines up with VWAP ($83.01) and the SMA200 ($82.81) as an overhead resistance cluster. [Bullish]
- CMF (20): -0.003, drifting down from +0.134 on Oct 30 and now at the zero line. Price rose while buying pressure faded, so there is no accumulation confirming the rally. [Neutral]
- ADX (14): 17.9 and falling (it was 25 on Oct 19), which signals weak or range-bound conditions. +DI 31.1 is above -DI 20.1, so bulls hold directional control, but without trend strength. [Weak Trend, Bullish lean]
- Volume: 38.33M, moderate. The Sept-Oct selloff had heavy volume, including a capitulation spike near the $76 low. The rebound has come on average to lower volume, which is a lack of strong conviction but also a sign sellers have been exhausted. [Neutral to Mildly Bullish]
DIVERGENCES & TRENDS
- Moving averages: The long-term structure is still bearish. The SMA50D ($79.91) is below the SMA200D ($82.81), a death cross already in place, and the EMA50 ($80.39) is below the EMA200 ($82.02). The SMA200D has been falling steadily from about $83.03 to $82.81 over the last 15 bars.
- Short-term reversal: Price has reclaimed the EMA50 and SMA50D, and the EMA50 is now rising. A close above the EMA200 ($82.02) and SMA200D ($82.81) would mark a regime shift.
- MACD: The bullish cross on Oct 22 (the line pulled above the signal) and the strong rebound from the deep trough is a clear momentum turn.
- RSI: The Oct low near 27 rebounded to 64. RSI is making higher lows over recent weeks.
- CMF: There is a mild bearish divergence. Price is near its recent high while CMF has fallen from +0.13 to zero.
- ADX: ADX has dropped from 25 to 17.9, so the move is losing trend strength even as +DI leads. This often precedes consolidation under resistance.
- Lower highs: The Feb high (~$87), the June high (~$84) and the Sept high (~$82.5) form a descending sequence that has not been broken. The $82-83 zone is the level to clear.
CHART PATTERNS
- Bullish Expanding Triangle (reversal, loose fit): Since June the lows have dropped from about $81 to about $76 while the highs have only slipped, giving a broadening downward structure. The sharp V-shaped rebound from the October low resembles the upside breakout out of this pattern. A confirmed move above $83 would target the $85-86 area, the mid-range of the prior consolidation.
- V-bottom recovery: The strong rebound from $76 to about $82 on rising momentum supports the reversal case. It is not a classic double bottom, because the second low is missing.
- Overhead resistance cluster ($82.0-$83.0): The EMA200, SMA200D, VWAP and upper Bollinger Band converge here. This acts like the neckline of a larger bear flag or descending structure. A rejection would send price back toward $80.4 (EMA50) and the $78-79 range.
POTENTIAL SCENARIOS
- Scenario 1: Bullish Breakout Above the 200-Day Cluster — Momentum (MACD, RSI, +DI) carries price through the $82-83 resistance zone, and the EMA50 continues rising toward the EMA200. Trigger: daily close above $83.05 (the VWAP and upper band) on improving volume and CMF above +0.05. Target: $85.00-$86.00, with $83.50 as the 83-day central estimate. Invalidation: daily close below $80.00 (below the EMA50). (50% probability)
- Scenario 2: Bearish Rejection at the Descending 200-Day Averages — Price stalls at the $82-83 resistance cluster, ADX stays weak and CMF turns negative, so the rally fades as a counter-trend bounce within the larger downtrend. Trigger: failure at $83 followed by a close below $80.39. Target: $78.00, then the $76.00 October low. Invalidation: sustained close above $83.50. (35% probability)
- Scenario 3: Neutral Range Consolidation — With ADX under 20, price chops between the EMA50 support and the 200-day averages for most of the window. Trigger: repeated closes between $80.00 and $83.00. Target: $80.50-$83.00. Invalidation: a close beyond either boundary on volume. (15% probability)
PRICE TARGETS
Timeframe: 83 days (Jan 30, 2027). Range width check: $90.50 - $75.50 = $15.00, which is 18.3% of $81.92. That fits the 61-180 day guidance of 18-30%.
- Target Price: $83.50 (83-day target)
- Expected Range: $75.50 to $90.50
- Key Levels: Support at $80.39 (EMA 50), Resistance at $82.81 (SMA 200D)
OVERALL BIAS
OVERALL BIAS: BULLISH - Momentum has turned up (MACD bullish cross, RSI in the low 60s, +DI above -DI) after a capitulation-style low, and price has reclaimed the EMA50 and SMA50D. The main hurdle is the $82-83 cluster of 200-day averages and VWAP. Weak ADX and fading CMF keep conviction modest, which is why the target is only modestly above the current price.
This is educational analysis and not financial advice.