XLE 83-day bearish forecast — Nov 8, 2026
- Bias: Bearish
- Timeframe: 83 days (made Nov 8, 2026, target date Jan 29, 2027)
- Price at analysis: $61.62
- Price target: $59.50
- Expected range: $53.00 – $66.50
- Result: Pending — graded after the close on Jan 29, 2027
Get a free AI analysis of XLE today
Analysis
TECHNICAL INDICATORS
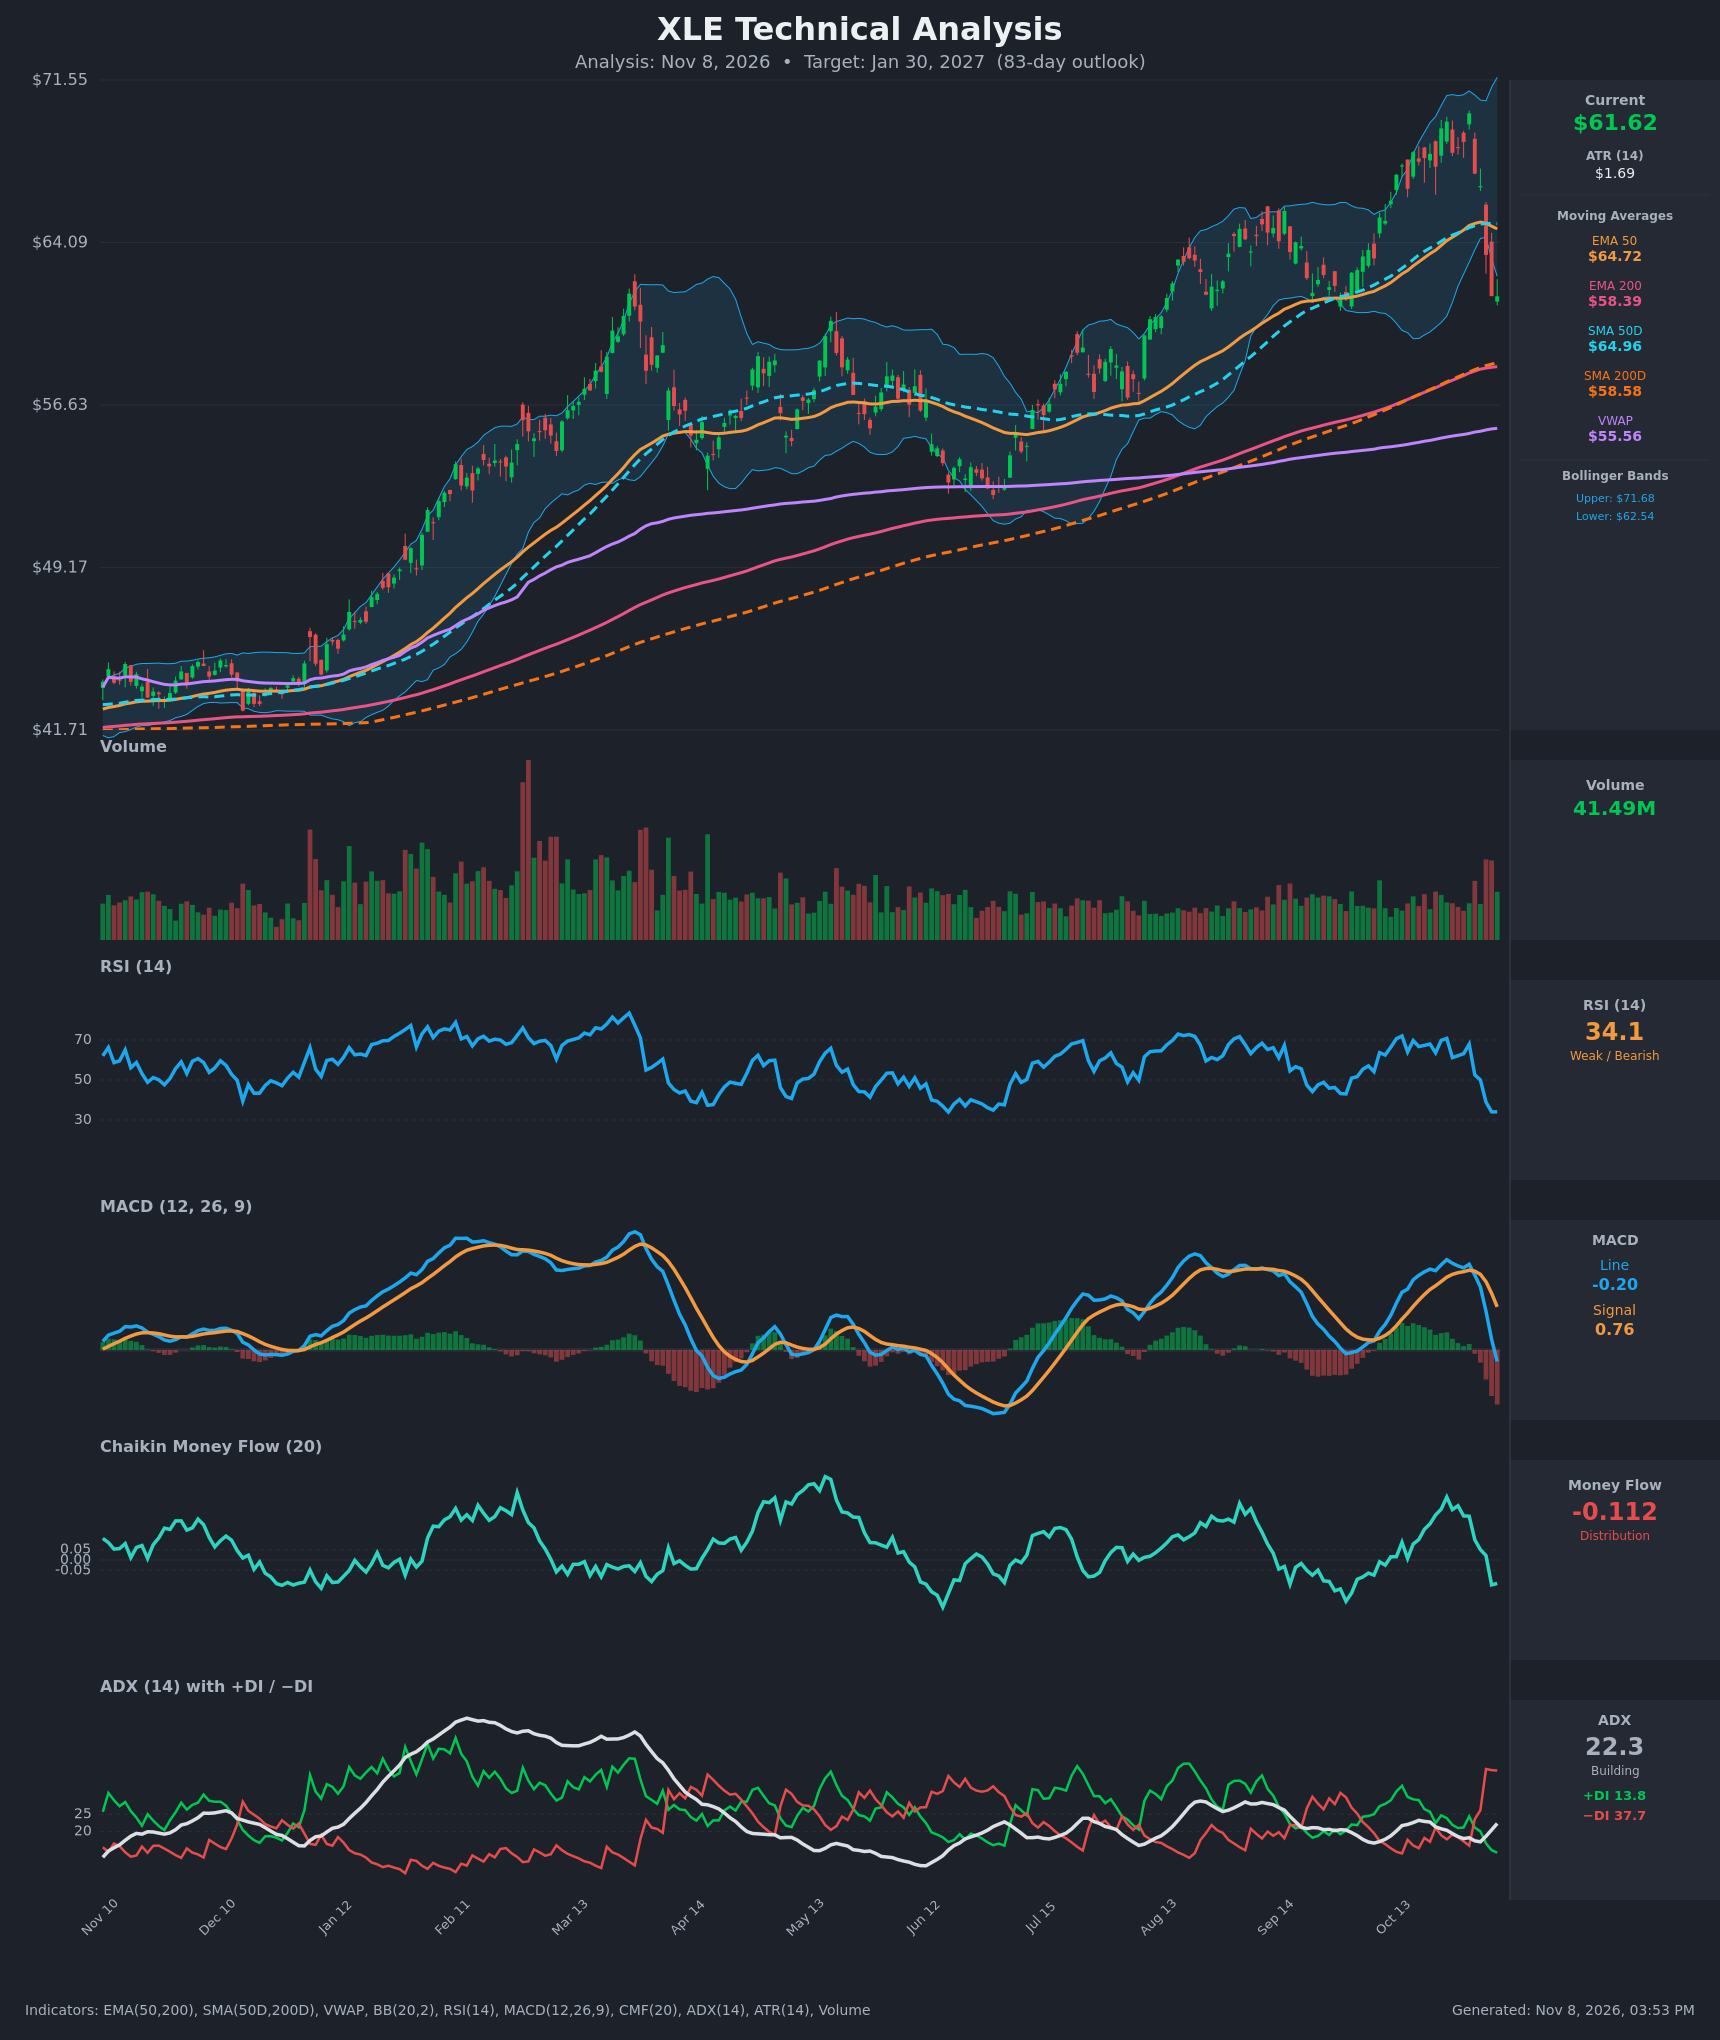
- RSI (14): 34.06, down sharply from about 70 on Oct 26 and 67.9 on Oct 30. It is approaching oversold (<30) but not there yet, and it has been flat at 34.1 for the last two bars. Momentum is clearly negative, though a short-term bounce is possible. [Bearish]
- 20 EMA: No 20 EMA value was supplied. The Bollinger midline (the 20-period average) sits at about $67.1, and price at $61.62 is well below it, so it now acts as resistance. EMA 50 at $64.72 is also overhead and sloping down after peaking near $65.03. [Bearish]
- MACD: Line -0.203 is below signal 0.758. The bearish crossover came on Nov 6, after the line fell from 1.51 on Oct 30. The histogram is deeply negative and expanding on the chart. [Bearish]
- Bollinger Bands (20): Upper $71.68, lower $62.54. Price at $61.62 is just below the lower band after a sharp reversal from the upper band area. This is an oversold stretch that often brings a bounce, but a close outside the band in a fresh downturn can also signal momentum continuing lower. The bands are still wide from the prior rally. [Bearish]
- CMF (20): -0.112, down from +0.30 on Oct 26. It crossed below -0.05 on Nov 5 and signals active distribution. [Distribution]
- ADX (14): 22.3 and rising from 17.0 on Nov 3, so a trend is emerging. −DI at 37.7 is far above +DI at 13.8, so the bears are in control. The ADX is still below 25, so the downtrend is not yet confirmed as strong. [Weak-to-Building Trend, Bearish]
- Volume: 41.49M, with the Nov 4-5 selloff bars on visibly elevated volume. Heavy volume on the down days points to real distribution rather than a low-volume pullback. [Bearish]
DIVERGENCES & TRENDS
- There is no bullish RSI or MACD divergence yet. RSI and MACD are making fresh lower readings in line with price.
- The price high near $70 (Oct 30) came with a lower MACD (1.51 vs 1.59 on Oct 26) and a falling CMF. That is a mild bearish divergence that preceded the drop.
- Moving averages: Price has lost EMA 50 ($64.72) and SMA 50D ($64.96) and is now between the 50s and the 200s. EMA 200 ($58.39) and SMA 200D ($58.58) are rising and sit about 5% below price. That keeps the long-term uptrend intact for now, and the 200s are the key support zone.
- Crossovers: MACD crossed bearish on Nov 6. −DI crossed above +DI on Nov 2 and has widened since. The golden cross is already in place (50s above 200s), but the 50/200 gap is narrowing slowly as the 50s flatten.
- VWAP: Price is above VWAP ($55.56), so the longer-term bias is not broken yet.
- Past behavior: Earlier in the chart, a similar sharp RSI drop from ~70 (Mar) led to a multi-week pullback of about 10%, with the lower Bollinger band and the 50-day average eventually acting as support.
CHART PATTERNS
- Bearish Double Top (reversal): Highs near $69.64 (Oct 26) and $70.02 (Oct 30) were separated by a dip to about $68.2. The decisive drop through $67 and then $63.5 confirms a breakdown. The measured-move target is roughly $60-61, and an extended move reaches the 200-day area near $58.4.
- Bearish Head and Shoulders-style rounded top: Not clearly formed, so I give it low weight.
- Bullish context: The prior uptrend from about $42 and the rising 200-day averages favor a bounce at the $58-59 support zone. A retest of that zone would be a normal correction within a larger bull trend.
- Trend structure: The sell-off is a sharp impulse leg. Expect a bounce or consolidation, then a probable test of the 200 averages.
POTENTIAL SCENARIOS
- Scenario 1: Bearish Pullback to the 200-Day Zone — The double-top breakdown continues, with bounces capped at the 50-day averages. Price tests the EMA 200/SMA 200D cluster around $58.4-58.6 and may briefly undercut it. Trigger: failure to reclaim $64.7 and a daily close below $60. Target: $58.4-59.5, extended to $55.5 (VWAP) if the 200s fail. Invalidation: a daily close above $65 with MACD back above signal. (45% probability)
- Scenario 2: Bullish Oversold Rebound and Trend Resumption — The oversold bounce from the lower band holds the 200 averages and rebuilds the uptrend. Price reclaims the 50-day averages and heads back toward the prior highs. Trigger: RSI turning up from the low 30s, CMF back above 0, and a close above $64.97. Target: $66-68 (retest of $70 possible). Invalidation: a close below $58.4. (33% probability)
- Scenario 3: Neutral Range Between the 200s and the 50s — Price chops between about $58.5 and $65 as ADX stays near 20-22. Trigger: low-volume basing around $59-62. Target: $60-63. Invalidation: a close outside the $58-65 range. (22% probability)
PRICE TARGETS
- Target Price: $59.50 (83-day horizon, Jan 30, 2027)
- Expected Range: $53.00 to $66.50. Width is $13.50, which is about 21.9% of the current price and fits the 61-180 day guidance of 18-30%.
- Key Levels: Support at $58.40 (EMA 200, with SMA 200D at $58.58), Resistance at $64.72 (EMA 50, with SMA 50D at $64.96)
OVERALL BIAS
OVERALL BIAS: BEARISH - The double-top breakdown with a bearish MACD crossover, −DI dominance, negative CMF and heavy-volume selling favors a drift toward the 200-day average zone near $58-59.5. Conviction is modest because price is oversold and the long-term trend and 200-day support are still intact.
This is educational analysis and not financial advice.