BAC 97-day bearish forecast — Nov 8, 2026
- Bias: Bearish
- Timeframe: 97 days (made Nov 8, 2026, target date Feb 12, 2027)
- Price at analysis: $49.42
- Price target: $47.50
- Expected range: $41.50 – $53.50
- Result: Pending — graded after the close on Feb 12, 2027
Get a free AI analysis of BAC today
Analysis
TECHNICAL INDICATORS
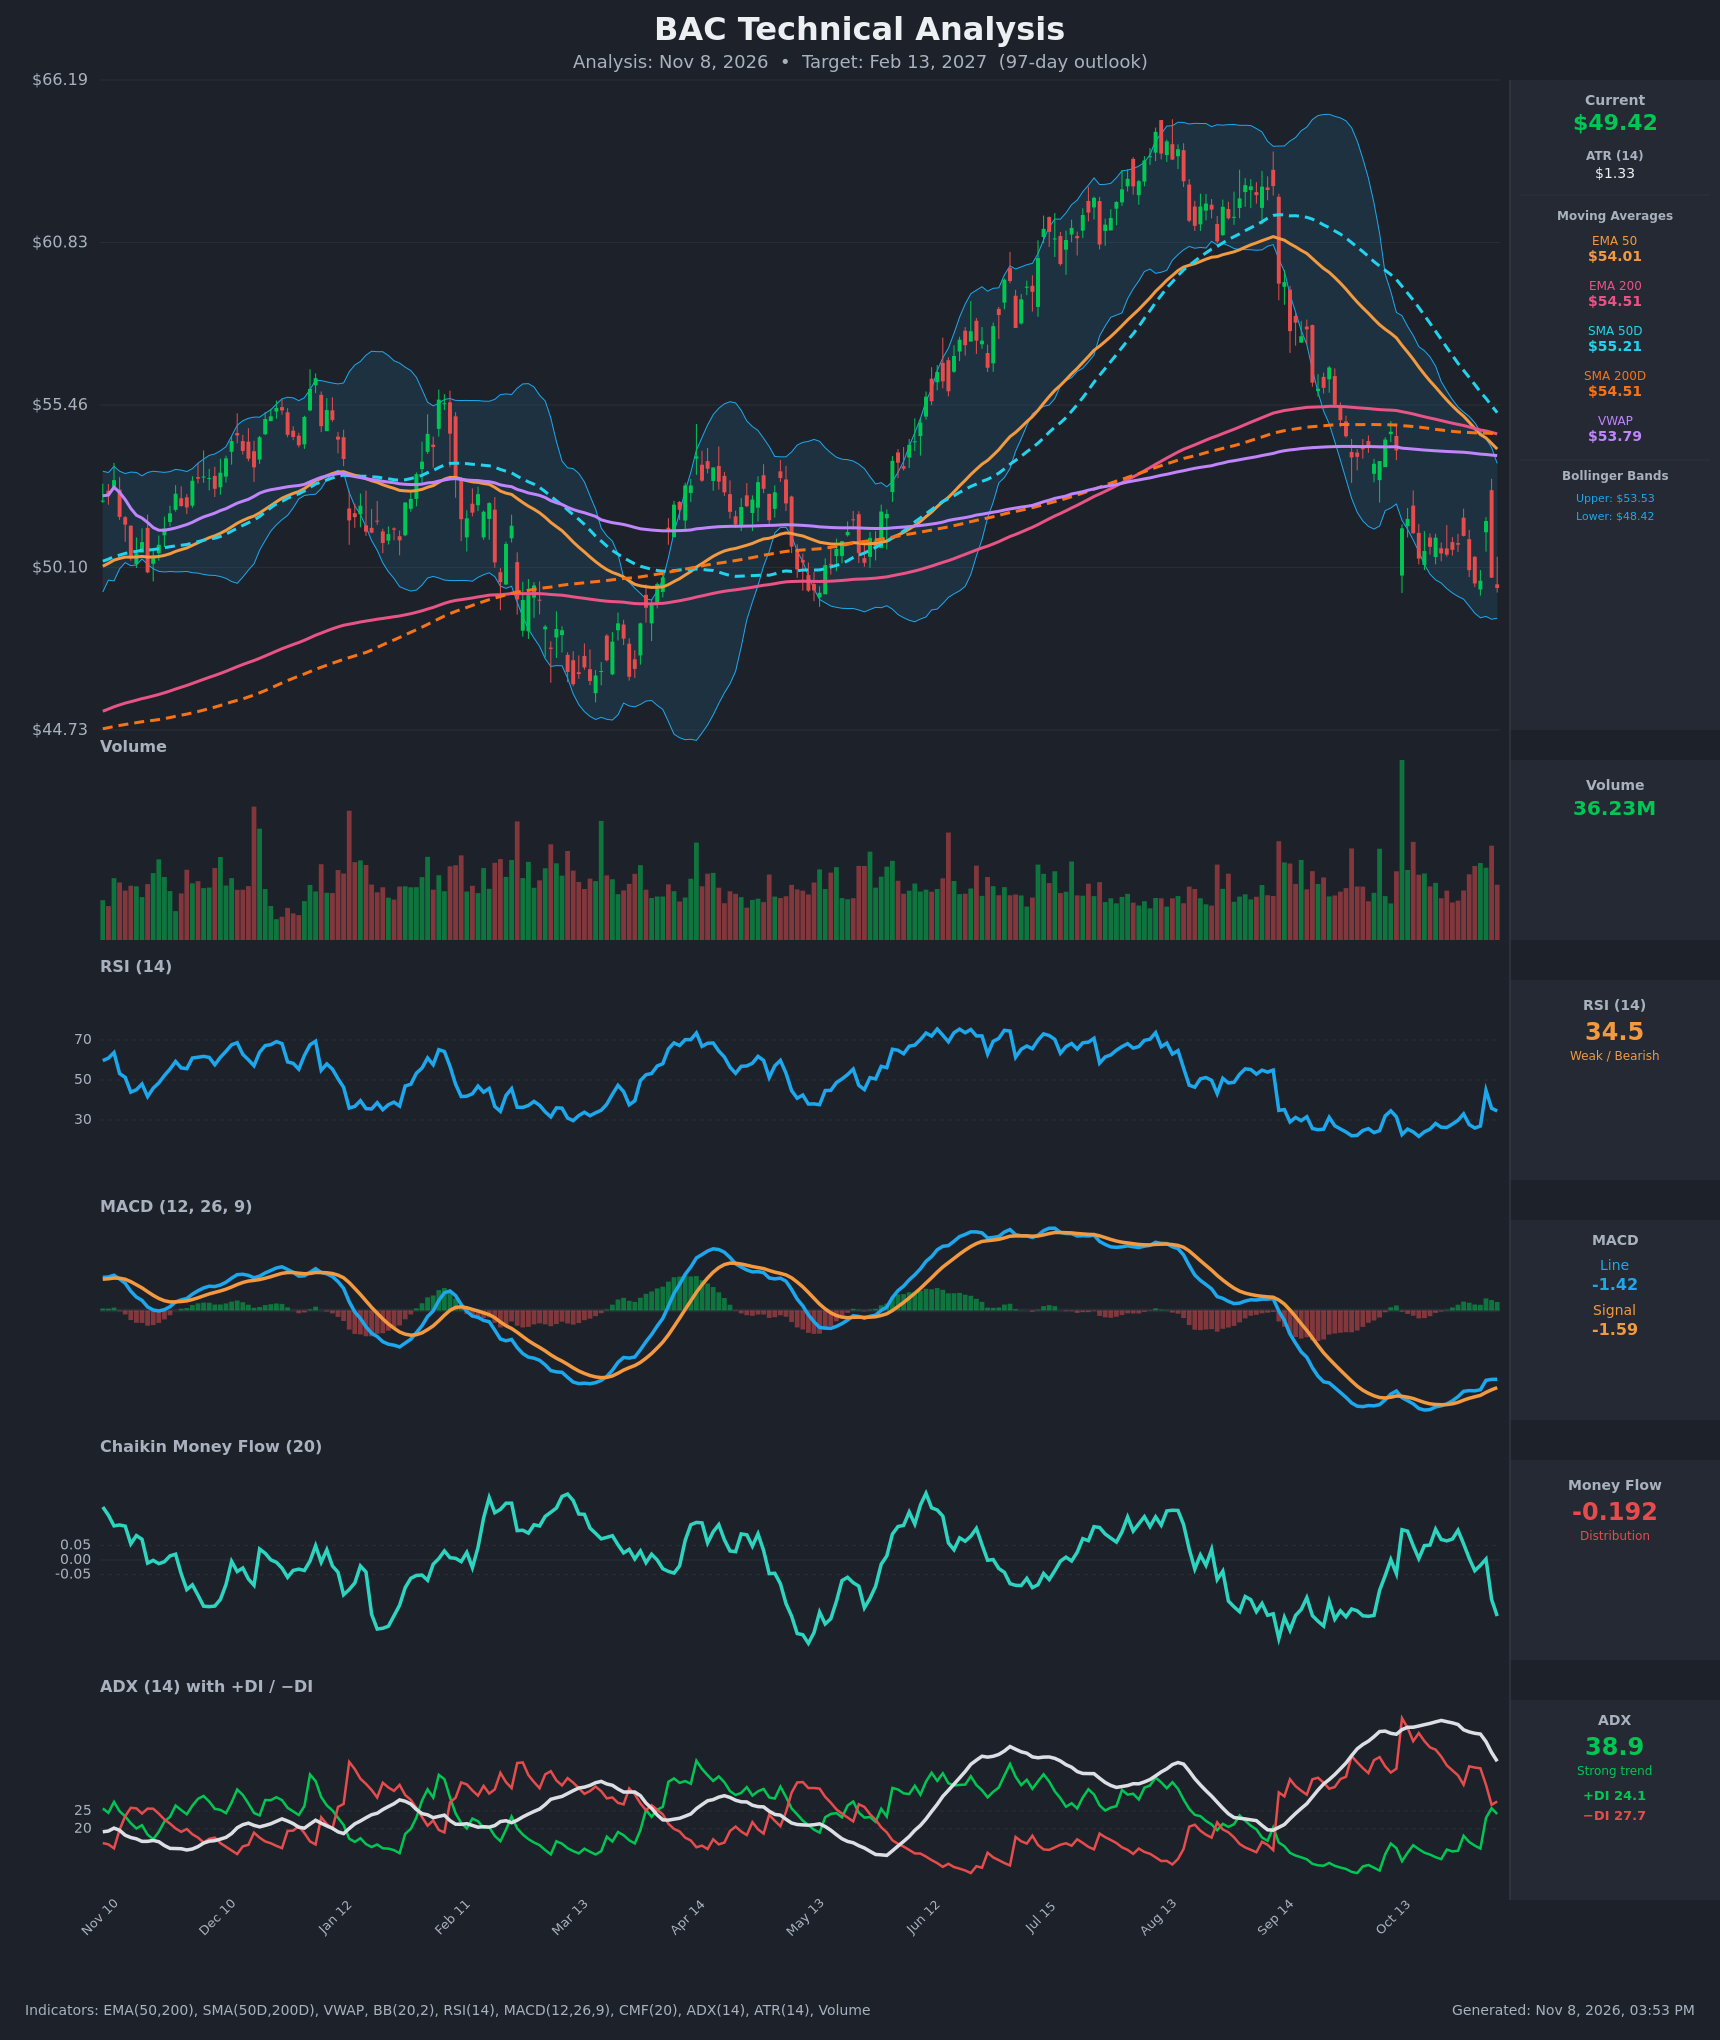
- RSI (14): 34.52. It has bounced from deeply oversold readings (21.8 on Oct 19), but it is still below 40 and has failed to reclaim 50 since early September. The Nov 4 spike to 44.8 faded quickly, so momentum is recovering but still weak. [Bearish]
- 20 EMA: The 20 EMA is not supplied. The EMA 50 ($54.01) is falling and sits below the EMA 200 ($54.51), which is a bearish EMA cross already in place since Nov 2. Price is about 8.5% below the EMA 50, and these averages now act as overhead resistance. [Bearish]
- MACD: The line (-1.415) is above the signal (-1.589), so the histogram is slightly positive and rising. This is a mild bullish crossover, but both lines are deep below zero. It signals a fading downside impulse rather than a trend reversal. [Neutral]
- Bollinger Bands (20): Price at $49.42 is in the lower third of the band ($48.42 lower, $53.53 upper), close to the lower band. The bands are fairly wide after the September-October selloff. Price has been riding the lower half since mid-September with repeated rejections near the mid-band. [Bearish]
- CMF (20): -0.192, which is distribution. It dropped from about +0.10 in late October to -0.19 in the past few sessions as the price bounce was sold into. This is the clearest warning that the bounce lacks buying support. [Distribution]
- ADX (14): 38.9 and falling from a 50.4 peak, with −DI (27.7) above +DI (24.1). The trend is still strong and bearish, but it is maturing, and the DIs are converging (−DI was 46.9 on Oct 19). A bullish DI crossover is possible soon, so this needs watching. [Strong Trend – Bearish, weakening]
- Volume: 36.23M, above the recent average. The Nov 4 reversal day and the selloff days carried heavy volume, and the latest decline came on expanding volume. That suggests selling pressure is still active near the lows. [Bearish confirmation]
DIVERGENCES & TRENDS
- Bullish divergence: On Nov 6 price closed at $49.42, below the Oct 19 close of $50.39. RSI is higher (34.5 vs 21.8), and the MACD line is higher (-1.42 vs -2.02). Selling momentum is clearly exhausting, which argues for a bounce or a base rather than a collapse.
- Moving averages: Price is below the EMA 50, EMA 200, SMA 50D, SMA 200D and VWAP ($53.79). The EMA 50 has already crossed below the EMA 200. The SMA 50D ($55.21) is rolling over fast toward the SMA 200D ($54.51), so a death cross is likely within days. The SMA 50D fell from $58.68 to $55.21 in 15 bars.
- Money flow and trend strength: CMF has gone from slightly positive to clearly negative, which contradicts the momentum improvement. −DI remains on top.
- Price structure: The decline from about $64 (Aug) to $49 is a clean downtrend with lower highs. The rebound attempts ($51.14 on Oct 29, $51.63 on Nov 4) were each sold.
CHART PATTERNS
- Bearish flag/rectangle consolidation: After the sharp drop from about $60 to $50, price has ranged roughly $49.5–$51.6 for about six weeks. The latest close at $49.42 is pushing through the bottom of that range, which matches the bearish continuation structure. The measured move would be roughly $9–10 below the breakdown, but the March low near $46–47 is a major support zone and should limit the decline.
- Bullish falling-wedge/double-bottom counter-case: The RSI and MACD divergence and the $49.5 retest of the October low could form a double bottom. It is only confirmed above $51.60, and then the $53.5–54.5 MA cluster. This is not yet confirmed.
- Pending death cross (SMA 50D/200D): This is a lagging bearish signal that supports a bearish bias for the next few months.
POTENTIAL SCENARIOS
- Scenario 1: Bearish Breakdown and Drift to Prior Lows — The consolidation breaks down, and the distribution (CMF) and the −DI dominance continue under the death cross. Price drifts toward the March lows. Trigger: daily close below $48.40 (lower Bollinger Band) on firm volume. Target: $46.00–$47.50. Invalidation: daily close above $51.65 with CMF back above zero. (50% probability)
- Scenario 2: Bullish Oversold Reversal — The RSI/MACD divergence resolves upward, and price forms a double bottom near $49 and mean-reverts toward the falling MAs. Trigger: close above $51.65 and a +DI/−DI bullish crossover. Target: $53.50–$54.50 (upper Bollinger Band and EMA 200 area). Invalidation: close below $48.00. (35% probability)
- Scenario 3: Neutral Range Chop — Price oscillates between about $47.50 and $52.50 as the trend strength fades (ADX falling). Trigger: ADX dropping below 25 with price stuck inside the band. Target: around $49–$51. Invalidation: close outside $46.50–$53.50. (15% probability)
PRICE TARGETS
- Target Price: $47.50 (97 days, around Feb 13, 2027)
- Expected Range: $41.50 to $53.50 (width $12.00, about 24.3% of current price, consistent with the 61–180 day guidance)
- Key Levels: Support at $46.50, Resistance at $51.60
OVERALL BIAS
OVERALL BIAS: BEARISH - Price is below every major moving average with a death cross imminent, −DI is above +DI with ADX still strong, and CMF shows heavy distribution as the range floor breaks. The bullish RSI/MACD divergence limits the downside, so I expect a modest decline toward the $46–$47.50 support zone rather than a collapse.
This is educational analysis and not financial advice.