BB 97-day bullish forecast — Nov 8, 2026
- Bias: Bullish
- Timeframe: 97 days (made Nov 8, 2026, target date Feb 12, 2027)
- Price at analysis: $8.74
- Price target: $9.50
- Expected range: $7.95 – $10.15
- Result: Pending — graded after the close on Feb 12, 2027
Get a free AI analysis of BB today
Analysis
TECHNICAL INDICATORS
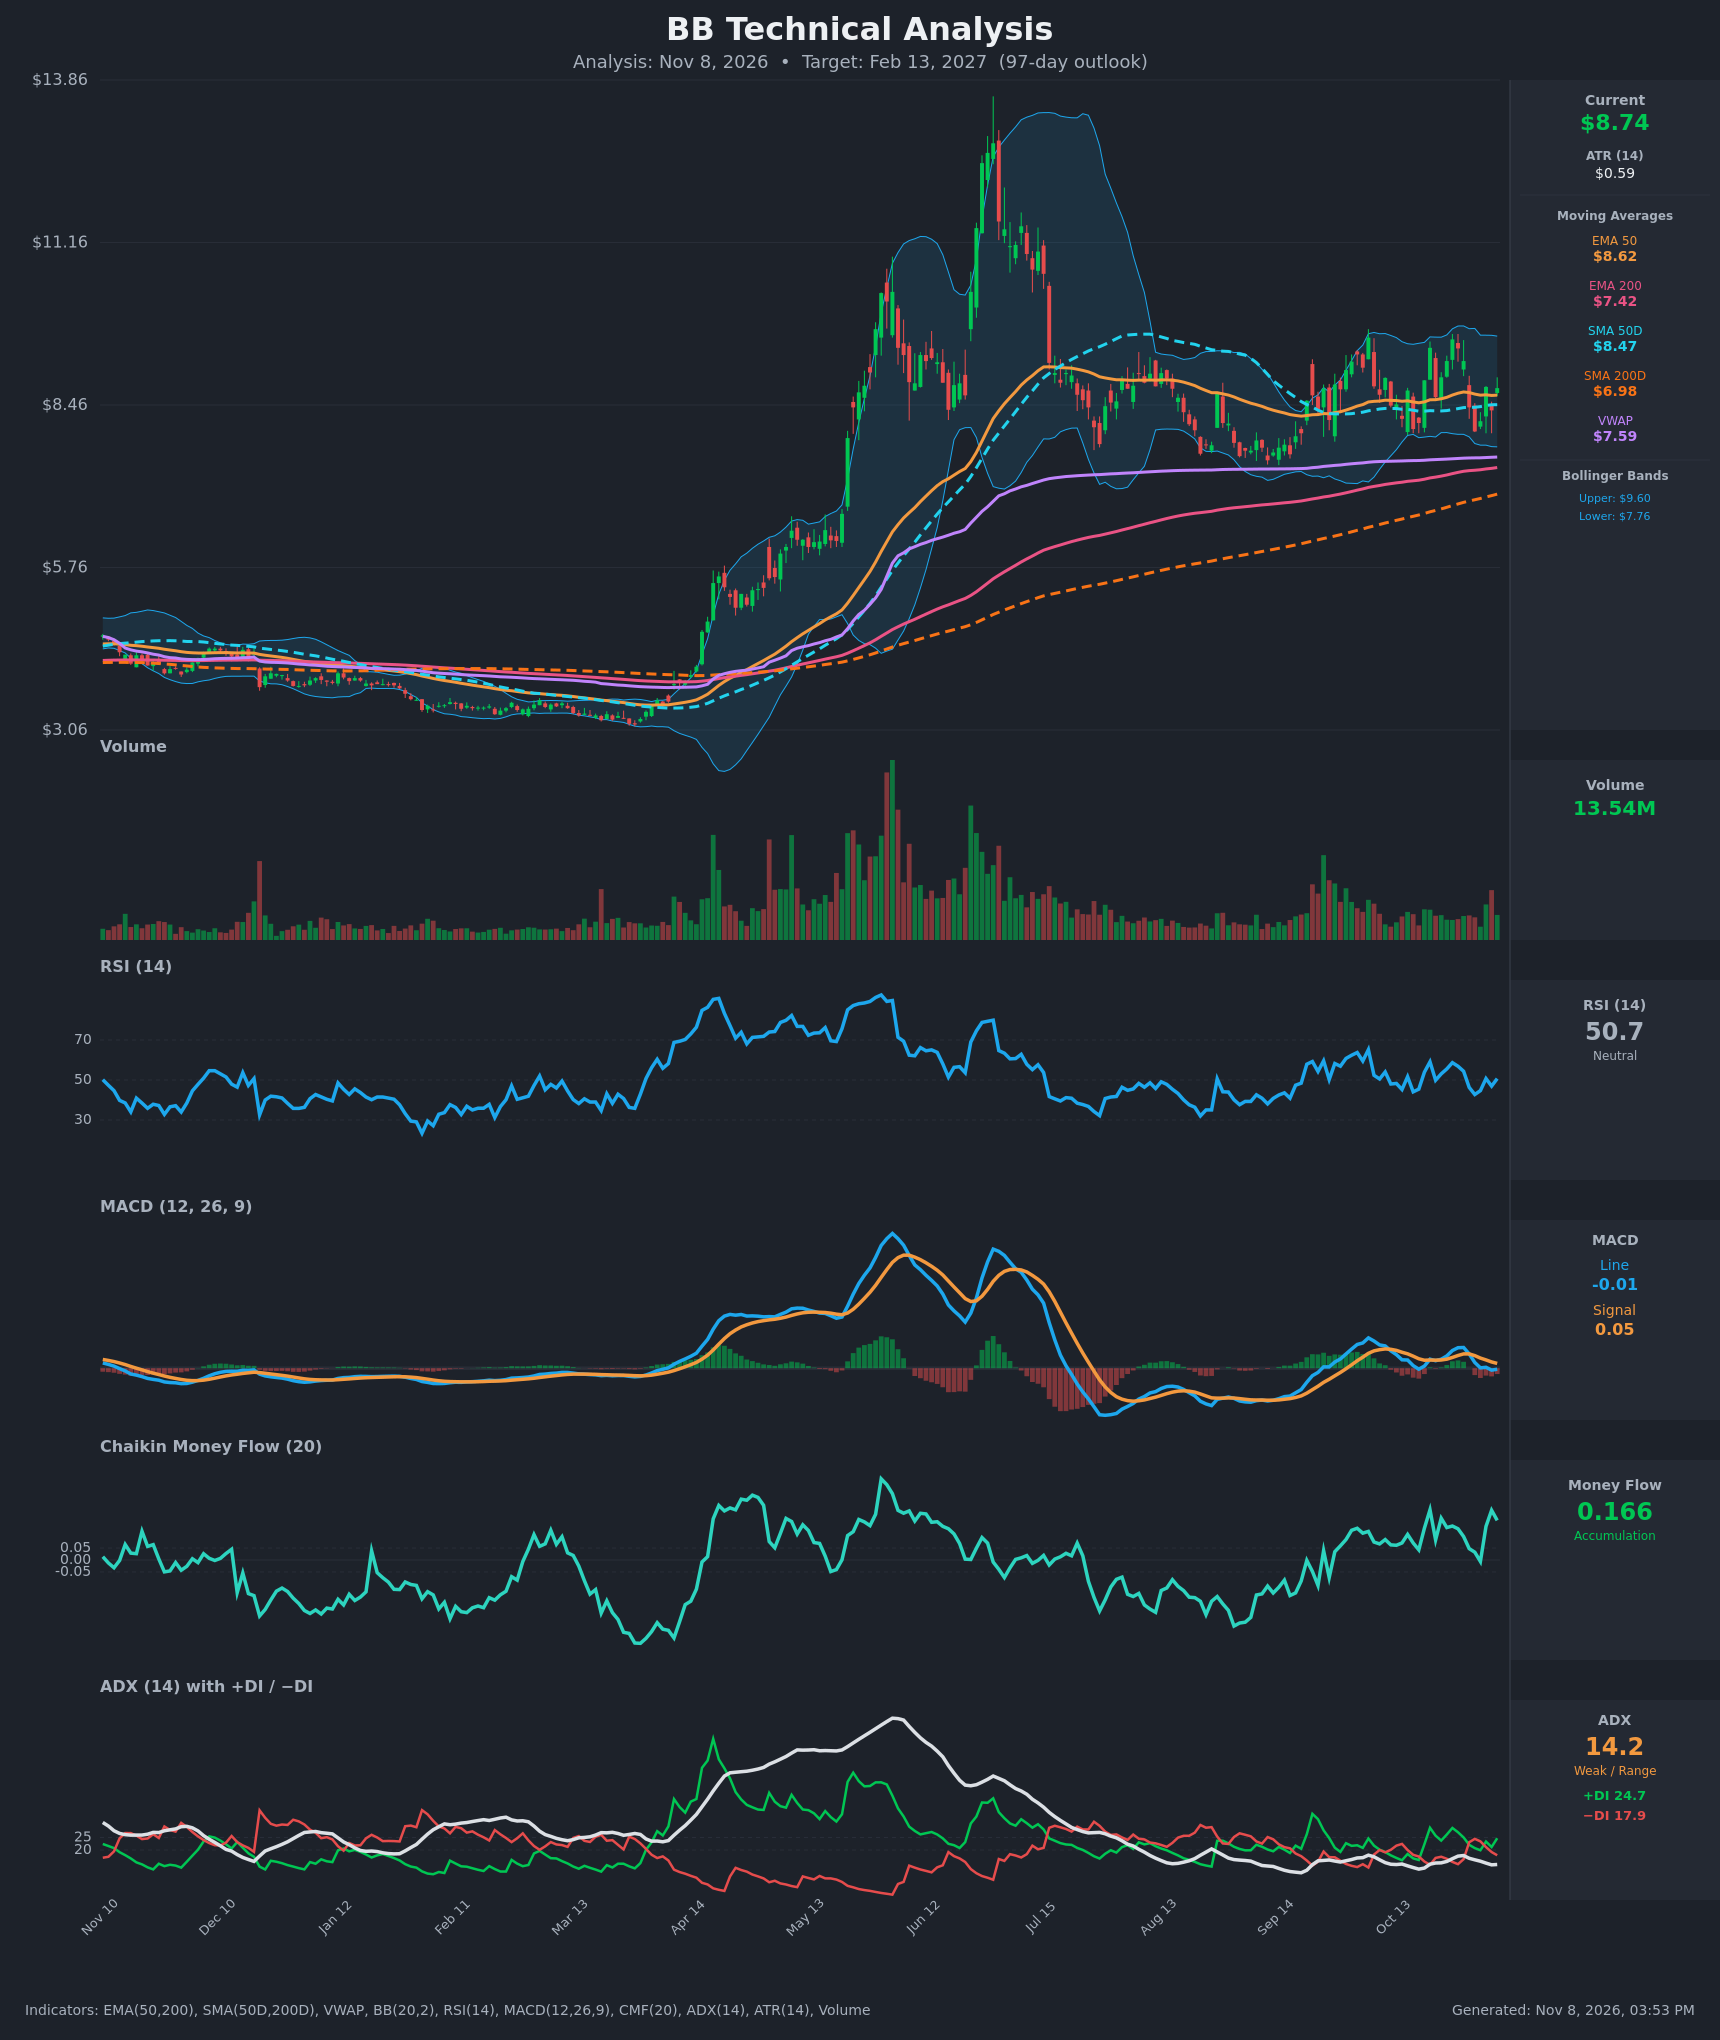
- RSI (14): 50.69, right at the midline. It was 58.7 on Oct 27 and fell to 42.7 on Nov 2 before recovering. It has oscillated between 42 and 59 for months, which shows neither overbought nor oversold conditions. [Neutral]
- 20 EMA: The 20 EMA isn't provided. The EMA 50 is $8.62 and price ($8.74) sits just above it, with the Bollinger midline near $8.68. The EMA 50 is flat, and price has repeatedly crossed it in both directions. It is mild support, but not decisive. [Neutral]
- MACD: Line -0.010 is below signal 0.046, with a slightly negative histogram. The bearish crossover came around Oct 30. Both lines are hugging zero, which signals fading momentum rather than a trend. [Bearish]
- Bollinger Bands (20): Upper $9.60, lower $7.76, midline about $8.68. Price is just above the midline. The bands have narrowed a lot from the spike-era expansion, which points to compression and a possible volatility expansion ahead. The $9.60 upper band lines up with the Oct 27 high of $9.55. [Neutral]
- CMF (20): 0.166, well above +0.05, and it has stayed positive almost throughout the last 15 bars. Buying pressure persisted even through the pullbacks, which is quiet accumulation. [Accumulation]
- ADX (14): 14.2 and falling from 17.8, so there is no trend. +DI (24.7) is above −DI (17.9), a mild bullish tilt, but the DIs have crossed back and forth recently. [Weak Trend, mild bullish lean]
- Volume: 13.54M, in line with the recent average and far below the volume at the spring and summer peaks. The September–October up-days carried somewhat more volume than the down-days. The quiet tape suggests coiling rather than distribution. [Neutral to mildly bullish]
- Moving averages and VWAP (context): Price is above the EMA 50 ($8.62), SMA 50 ($8.47), VWAP ($7.59), EMA 200 ($7.42) and SMA 200 ($6.98). The SMA 50 is far above the SMA 200 (golden cross already in place), and the long-term averages are all rising. This is a long-term uptrend structure. [Bullish]
DIVERGENCES & TRENDS
- No major price/RSI divergence. RSI peaked at 59.1 on the Oct 21 close of $9.41 and 58.7 on the Oct 27 close of $9.55. That is roughly confirming, not diverging.
- CMF vs. price: CMF is making higher readings (0.208 on Nov 5, 0.166 now) while price is stuck in the $8.0–$9.5 range. This is a mild bullish divergence and suggests accumulation.
- MACD: It crossed bearish on Oct 30 and has drifted slightly below zero. This is a short-term headwind, but with the histogram this small it is closer to noise than a trend change.
- ADX: It has fallen from the 30s–40s at the June peak to 14, confirming a prolonged consolidation after the blow-off move.
- Moving averages: The EMA 50 and SMA 50 are converging with price, so price is in a tug of war around them. The 200-day averages keep rising and are widening the gap below price, which supports the long-term uptrend.
- Higher lows: Lows have risen from about $7.3 in August–September to about $8.0 in early November, while the highs near $9.5 are flat. That is a loosely ascending structure.
CHART PATTERNS
- Primary: Ascending Triangle / Rectangle-style consolidation (continuation). Resistance is flat around $9.5–$9.6 and lows are gradually rising. The pattern follows a parabolic spike to about $13 and a roughly 40% retracement, so it reads as a base-building phase above the rising 200-day averages. The reference diagram shows a bullish resolution upward for this pattern.
- Target: Range height is about $2.2 (from about $7.4 to $9.6). A breakout above $9.6 gives a measured target of about $11.8. That is more than a 97-day move is likely to deliver in full, so I only assume partial follow-through.
- Alternate read (Bearish): A rejection at $9.5 with a break below $8.0 would turn this into a range or lower-high structure, with a downside test of the $7.4–$7.6 zone (VWAP, EMA 200).
- Mixed pattern: The earlier spike and retrace also resembles a large, rounded Head and Shoulders-type top on the macro scale. It has not been confirmed with a neckline break, and price remains well above the neckline-equivalent area near $7.4.
POTENTIAL SCENARIOS
- Scenario 1: Bullish Breakout from Base — Accumulation (CMF 0.166) and the long-term uptrend structure resolve the consolidation upward. Trigger: daily close above $9.60 on rising volume. Target: $9.50–$10.50, with a stretch target of $11.00 or higher. Invalidation: close below $8.00 (recent swing low and Nov 2 close). (50% probability)
- Scenario 2: Neutral Range Persistence — ADX stays under 20 and price chops between $8.0 and $9.5 around the flat 50-day averages. Trigger: repeated failures at $9.5 and buying at $8.0–$8.4. Target: $8.40–$9.10. Invalidation: close above $9.60 or below $7.90. (28% probability)
- Scenario 3: Bearish Breakdown — The MACD rollover and failure at resistance lead to a breakdown. Trigger: close below $8.00, then below the $7.76 lower band. Target: $7.40–$7.60 (VWAP and EMA 200 zone), possibly $7.00 (SMA 200). Invalidation: reclaim of $8.70 on volume. (22% probability)
PRICE TARGETS
Timeframe: 97 days (the 61–180 day band calls for roughly 18–30% width). The range below is $7.95 to $10.15, which is $2.20 wide, or 25.2% of the $8.74 price, in line with that guidance.
- Target Price: $9.50 (97 days)
- Expected Range: $7.95 to $10.15
- Key Levels: Support at $8.00, Resistance at $9.60
OVERALL BIAS
OVERALL BIAS: BULLISH - Price is above every moving average and VWAP, the 200-day averages are rising, CMF shows steady accumulation, +DI is above −DI, and lows are rising under flat resistance at about $9.5. The offsets are a small bearish MACD cross and a weak ADX, which keep conviction modest, so this is a moderate rather than strong call.
This is educational analysis and not financial advice.