KWEB 97-day bullish forecast — Nov 8, 2026
- Bias: Bullish
- Timeframe: 97 days (made Nov 8, 2026, target date Feb 12, 2027)
- Price at analysis: $24.88
- Price target: $26.40
- Expected range: $22.00 – $28.60
- Result: Pending — graded after the close on Feb 12, 2027
Get a free AI analysis of KWEB today
Analysis
TECHNICAL INDICATORS
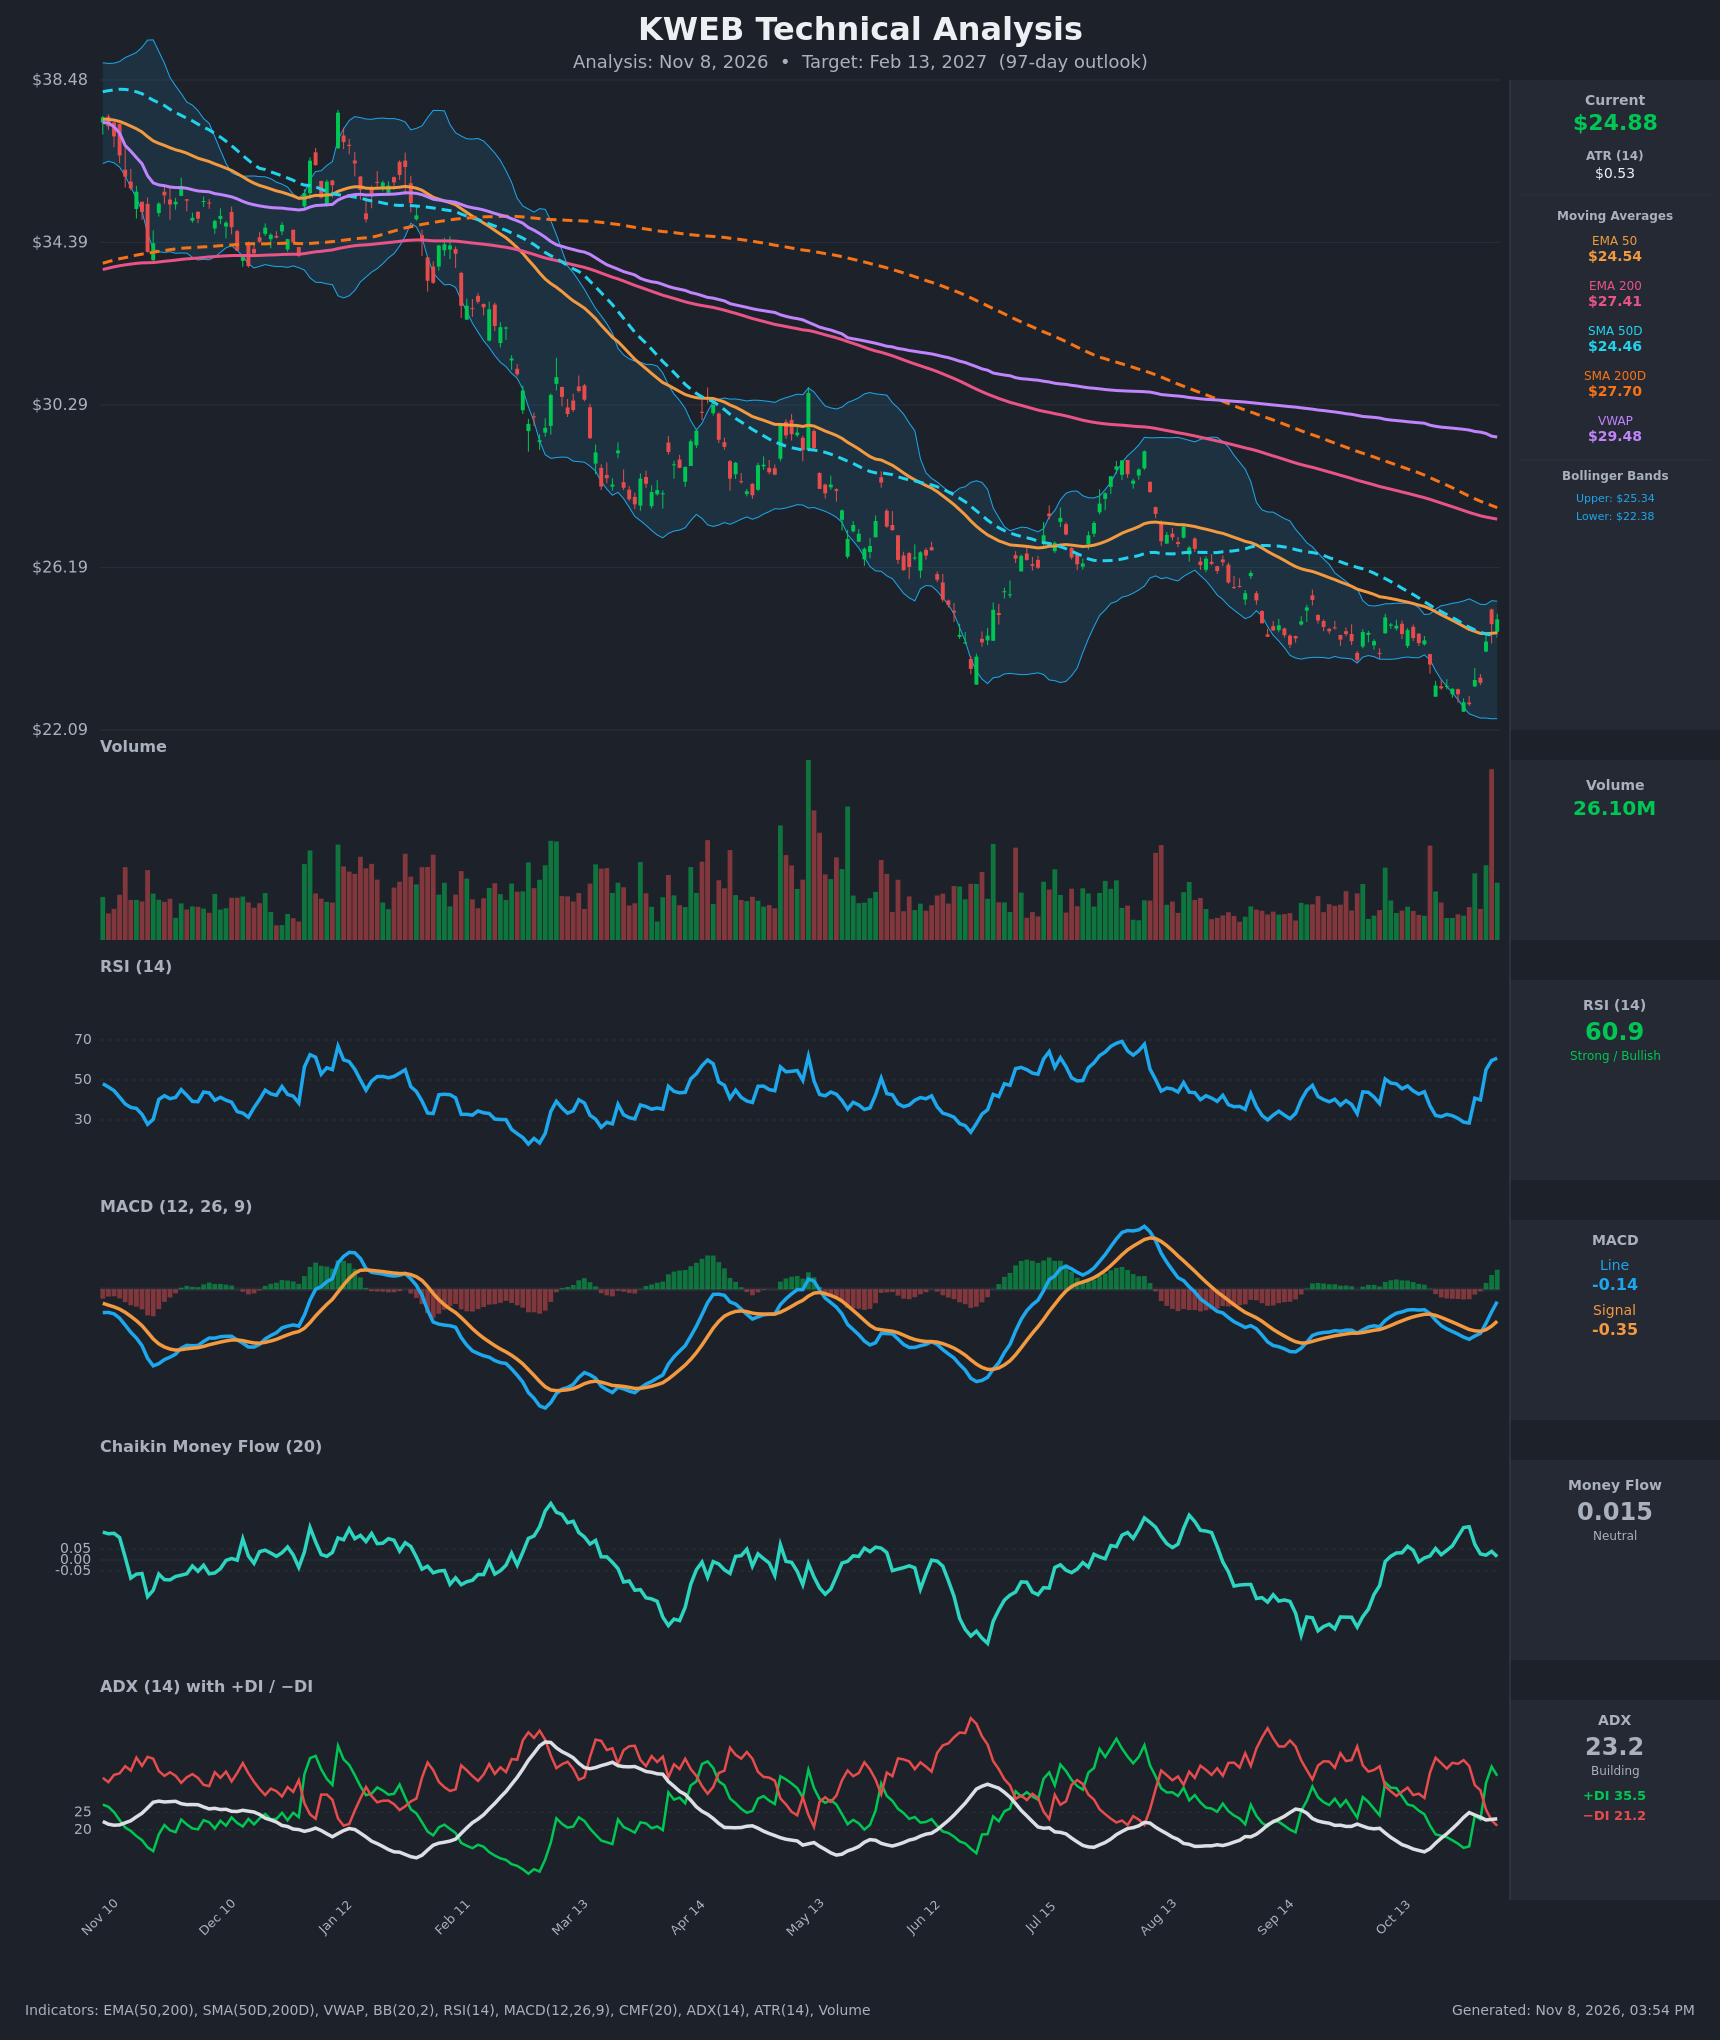
- RSI (14): 60.93, up sharply from 28.5 on Oct 30 and now near the top of its 30-60 range. The momentum swing is bullish and not yet overbought (the 70 level is where the Jul and Aug rallies stalled). [Bullish]
- 20 EMA: No 20 EMA was supplied. The EMA 50 ($24.54) and SMA 50D ($24.46) sit just under the $24.88 price, and price reclaimed both on Nov 4-5. They now act as first support, but the reclaim is only 1-2% deep. [Bullish]
- MACD: Line -0.136 is above signal -0.351, with a positive and expanding histogram. The bullish crossover happened around Nov 4. It is still below zero, so it is a recovery signal and not yet a trend-confirming one. [Bullish]
- Bollinger Bands (20): Price is $24.88 against bands of $22.38 and $25.34, so it sits in the upper quarter of the range, about $0.46 below the upper band. Price has moved from the lower band to the upper half in about a week. Bands are fairly narrow, hinting at a possible volatility expansion. [Bullish]
- CMF (20): 0.015 is inside the neutral band (±0.05) and has faded from 0.15 on Oct 30. The price bounce is not yet backed by clear accumulation. [Neutral]
- ADX (14): 23.2, in the building zone below 25, with +DI (35.5) well above −DI (21.2). The DI crossover on Nov 4 flipped control from sellers to buyers. The trend is emerging but not yet strong. [Weak/Building Trend, Bullish direction]
- Volume: 26.10M, a high-volume reversal bar relative to the recent average. The chart shows a spike near the lows, then green bars on the bounce. That fits capitulation followed by a relief rally, though follow-through volume is still needed. [Mildly Bullish]
- Long-term MAs / VWAP: Price is below EMA200 ($27.41), SMA200D ($27.70) and VWAP ($29.48). EMA50 is below EMA200 and SMA50D is below SMA200D, which is a death-cross configuration. The primary trend is still down. [Bearish]
DIVERGENCES & TRENDS
- Price made a slightly lower low in late Oct (~$22.74) versus the June low (~$23.2). RSI on that low (~28.5) was roughly in line with the June low (~27), so there is no clean divergence. MACD in Oct was much shallower than in June, which is a mild bullish momentum improvement.
- The DI crossover (+DI over −DI on Nov 4) came with ADX rising to 23, a fresh bullish trend attempt.
- The MACD bullish crossover and RSI's break above 50 confirm the short-term turn.
- Price reclaimed the 50-day averages, which had acted as resistance all fall. Both are now flat-to-falling and converging with price.
- Overhead, the 200-day averages are still declining at $27.41-$27.70, and VWAP is far above at $29.48. These are the main hurdles.
- CMF is flat and neutral, which lags the price and RSI improvement.
CHART PATTERNS
- Bullish double bottom (loose): Lows near $23.2 (June) and $22.7 (late Oct) form a base. The neckline is the Aug high near $29, so confirmation is far away and the full measured move would be ambitious. Treat it as a base-building clue and not a confirmed signal.
- Downtrend channel / falling wedge character: The decline since the start of the chart has produced lower highs and lower lows, with each leg shallower in momentum. A break above the 50-day averages and a move toward $27.4 would support a bullish reversal read.
- Resistance cluster: EMA200 at $27.41, SMA200D at $27.70 and the late-summer congestion around $27-28 form the first major test of the reversal.
- No bearish top pattern is confirmed. The main bearish risk is a failed rally at the declining 200-day averages.
POTENTIAL SCENARIOS
- Scenario 1: Bullish Reversal Toward the 200-Day Averages — The MACD and DI crossovers, price above the 50s, and RSI above 60 extend into a multi-week recovery. Price grinds toward the EMA200/SMA200D zone. Trigger: a daily close above $25.34 (upper Bollinger Band) with rising volume, then above $26.20. Target: $26.40-$27.40. Invalidation: a daily close below $23.60. (50% probability)
- Scenario 2: Bearish Failed Bounce and Retest of Lows — The rally stalls at the upper band or the 200-day averages. Price rolls back under the 50s and retests the $22.4-$22.7 lows, resuming the primary downtrend. Trigger: a close below $24.40 (50-day cluster) and MACD crossing back down. Target: $22.50, with a break of $22.40 opening $21. Invalidation: a close above $27.70. (30% probability)
- Scenario 3: Neutral Range Between the 50s and 200s — Price oscillates between ~$23.5 and ~$27.0 as the market digests the bounce. Trigger: ADX falling back below 20 with flat CMF. Target: $24-$26.50. Invalidation: a close above $27.70 or below $22.40. (20% probability)
PRICE TARGETS
- Target Price: $26.40 (97 days, Feb 13, 2027)
- Expected Range: $22.00 to $28.60 (width $6.60, about 26.5% of the current price, consistent with the 61-180 day guidance of 18-30%)
- Key Levels: Support at $24.46 (SMA50D/EMA50 cluster; $22.74 is major support), Resistance at $27.41 (EMA200; SMA200D at $27.70 just above)
OVERALL BIAS
OVERALL BIAS: BULLISH - Momentum has turned up, with a MACD bullish crossover, a +DI/−DI flip, RSI above 60 and price reclaiming the 50-day averages after a capitulation-type low. The bounce is likely to face resistance at the declining 200-day averages near $27.4-$27.7, and the primary trend is still down, so conviction is modest.
This is educational analysis and not financial advice.