IWM 97-day bearish forecast — Nov 8, 2026
- Bias: Bearish
- Timeframe: 97 days (made Nov 8, 2026, target date Feb 12, 2027)
- Price at analysis: $273.67
- Price target: $266.00
- Expected range: $243.00 – $294.00
- Result: Pending — graded after the close on Feb 12, 2027
Get a free AI analysis of IWM today
Analysis
TECHNICAL INDICATORS
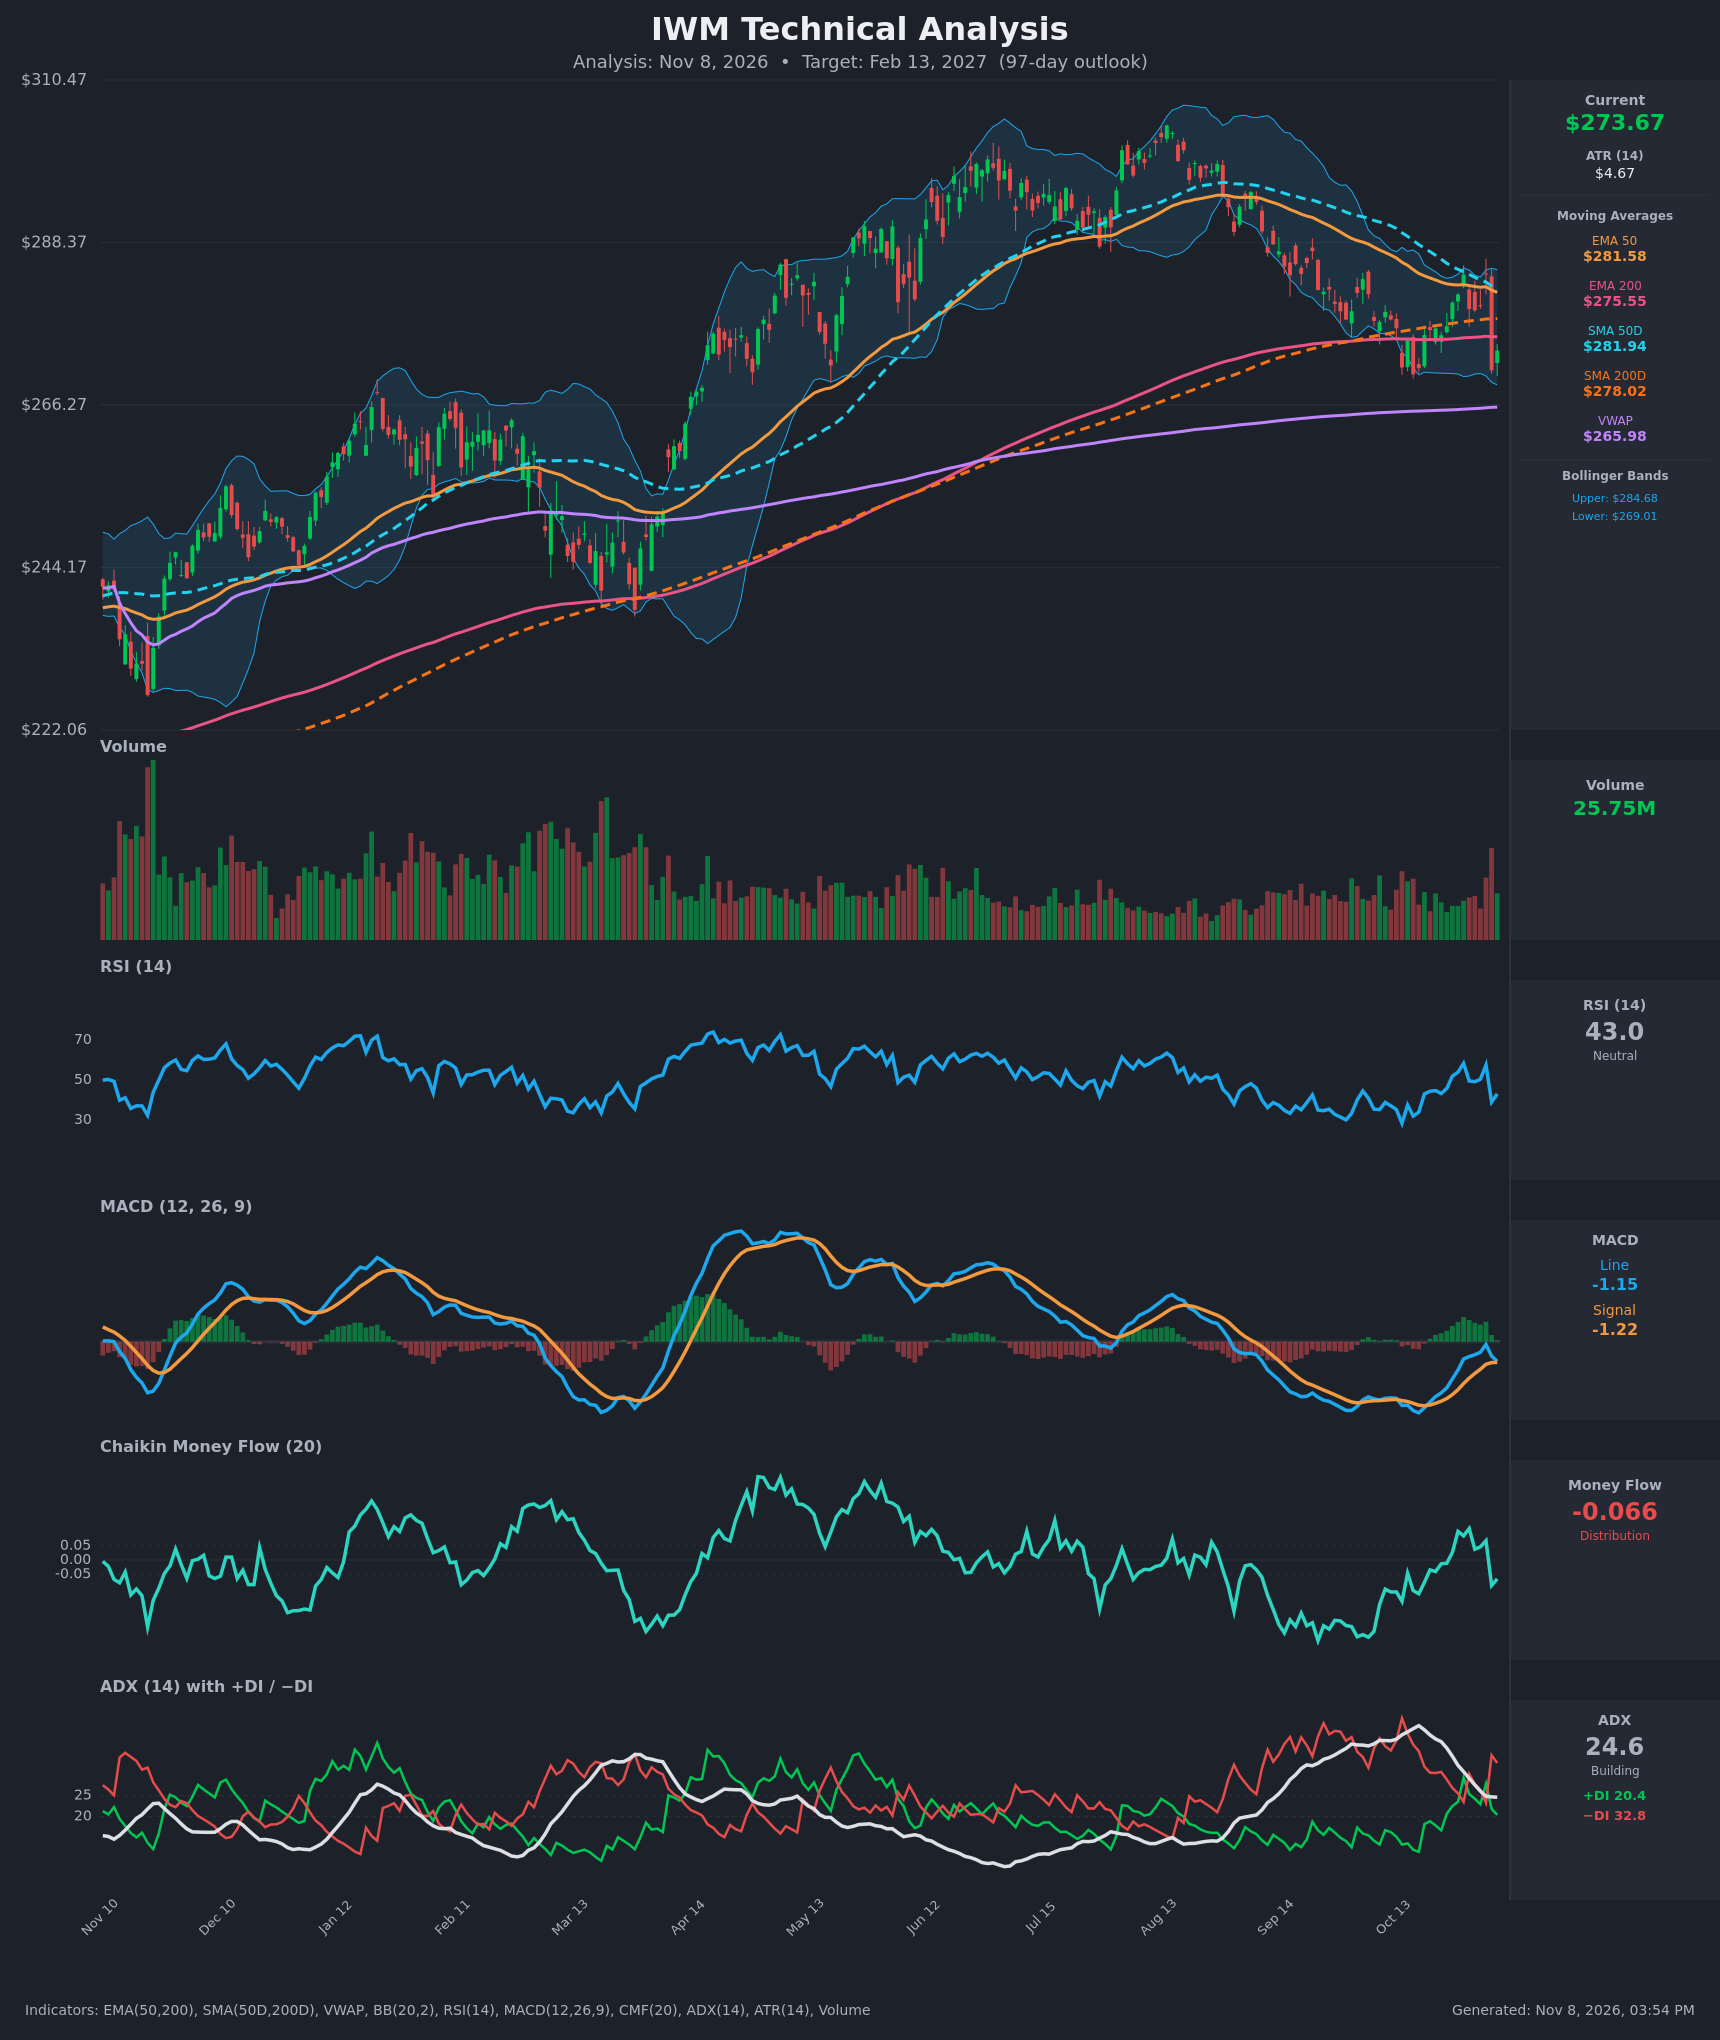
- RSI (14): 43.05. It fell from 57.5 to 39.0 on Nov 5 and has only partly recovered. It sits below 50 and is not oversold. Over the past month it has repeatedly failed to hold above 55-58, which is a pattern of lower momentum highs. [Bearish]
- 20 EMA: The 20 EMA isn't supplied, so I use the EMA 50 ($281.58) as the working average. Price ($273.67) is about 2.8% below it, and the EMA 50 is sloping down (from $284.16 to $281.58 in 15 bars). Price is also below the EMA 200 ($275.55), so the intermediate average acts as resistance. [Bearish]
- MACD: The line is -1.155 and the signal is -1.216, so the histogram is barely positive (+0.06). It has shrunk from about +1.16 on Nov 4 (line -0.167 vs signal -1.327) as the line rolled over from -0.167 to -1.155. A bearish cross below the signal looks imminent, and both lines are below zero. [Bearish]
- Bollinger Bands (20): The bands are $269.01 to $284.68 with a midline near $276.84, and price is in the lower third. The Nov 4 close of $284.02 was rejected at the upper band, followed by a -4.6% drop to $270.98. The lower band is close to the Oct 19 low of $271.28. Bandwidth is moderate, so there is no squeeze. [Bearish]
- CMF (20): -0.066, below the -0.05 threshold. It flipped from a mild positive reading (+0.068 on Nov 4) to distribution after the Nov 5 drop. The Oct 19 low was -0.118. [Distribution]
- ADX (14): 24.6, down from 41.7 on Oct 19, so the earlier strong downtrend is fading. −DI (32.8) is well above +DI (20.4), so sellers still control direction. The trend is borderline strength, and the ADX is flattening at the 25 line. [Moderate Trend, Bearish]
- Volume: 25.75M. The Nov 5 selloff came on one of the heaviest volume bars in recent months, which suggests distribution. The follow-through bounce is not on the same volume. [Bearish-leaning, high-volume rejection]
DIVERGENCES & TRENDS
- Trend structure: Price peaked near $305 in August and has made lower highs since (about $289 in September, then $284 in late Oct/early Nov). The lows near $270-271 have held twice (Oct 19 and Nov 5), so the 270 floor is the key line.
- Moving averages: Price is below the EMA 50, SMA 50D, SMA 200D and EMA 200. The SMA 50D ($281.94) is still above the SMA 200D ($278.02), but the gap has shrunk from about $11.4 to $3.9 in 15 bars. A death cross looks likely within weeks if the decline persists. The EMA 50 is also converging toward the EMA 200 ($281.58 vs $275.55), so a bearish EMA cross is possible too.
- Divergences: There is no clear bullish RSI divergence. RSI at the Nov 5 low (39) was higher than at the Oct 19 low (33.9), a mild positive sign, but it is not confirmed. The MACD momentum bounce has already rolled over.
- Crossovers: The MACD bearish cross is pending. The DI spread has re-widened in favor of −DI after +DI briefly nearly caught up on Oct 29 (29.2 vs 23.5).
- VWAP: Price is above the anchored VWAP ($265.98), which is the nearest major cushion and a bullish positive. It is the main support under the 270 floor.
CHART PATTERNS
- Broad top / lower-high structure: The August peak followed by lower highs resembles a Bearish Head and Shoulders / Bearish Double Top on a larger scale. The neckline is the $269-271 support zone. A break below it would imply a measured move of roughly $20-25 lower, to about $248-252.
- Possible Bullish Double Bottom: The twin lows at $271.28 (Oct 19) and $270.98 (Nov 5) form a potential double bottom. Confirmation requires a close above the intervening high near $284, which is also the SMA 50 and the upper Bollinger Band. That would project to about $297. This is the main counter-pattern.
- Range: Over the last month price has oscillated between $270 and $284, a range of about 5%, and the pattern is unresolved. With distribution, pending MA crosses and −DI dominance, the downside break is slightly more probable.
POTENTIAL SCENARIOS
- Scenario 1: Bearish Neckline Break & Death Cross — Price fails to reclaim the $276-282 MA cluster, the MACD crosses down, the death cross confirms, and the $270 floor breaks. Trigger: daily close below $269 on above-average volume. Target: $252-258, with the pattern measured move to about $248. Invalidation: daily close above $284 (SMA 50 / upper band). (48% probability)
- Scenario 2: Bullish Double Bottom Reversal — The $270-271 floor holds, price reclaims the EMA 200, SMA 200D and EMA 50, and breaks the late-Oct high. Trigger: close above $284 with improving CMF above +0.05. Target: $294-298. Invalidation: close below $268. (30% probability)
- Scenario 3: Neutral Range Chop — Price stays between $270 and $284 as ADX fades below 20 and the MAs flatten. Trigger: repeated failures at both $270 and $282. Target: $272-280. Invalidation: a daily close outside $268-$285. (22% probability)
PRICE TARGETS
- Target Price: $266.00 (97-day horizon, about 2.8% below the current price, a probability-weighted outcome with a modest bearish tilt)
- Expected Range: $243.00 to $294.00 (width $51 ≈ 18.6% of the current price, consistent with the 61-180 day guidance)
- Key Levels: Support at $270.00, Resistance at $278.02
OVERALL BIAS
OVERALL BIAS: BEARISH - Price is below all key moving averages with −DI dominating, CMF in distribution, a heavy-volume rejection at the $284 band, and a death cross and MACD bearish cross pending. The $270 double-bottom floor and the rising long-term averages keep the conviction modest.
This is educational analysis and not financial advice.