QCOM 97-day bearish forecast — Nov 8, 2026
- Bias: Bearish
- Timeframe: 97 days (made Nov 8, 2026, target date Feb 12, 2027)
- Price at analysis: $165.41
- Price target: $159.00
- Expected range: $140.00 – $181.00
- Result: Pending — graded after the close on Feb 12, 2027
Get a free AI analysis of QCOM today
Analysis
TECHNICAL INDICATORS
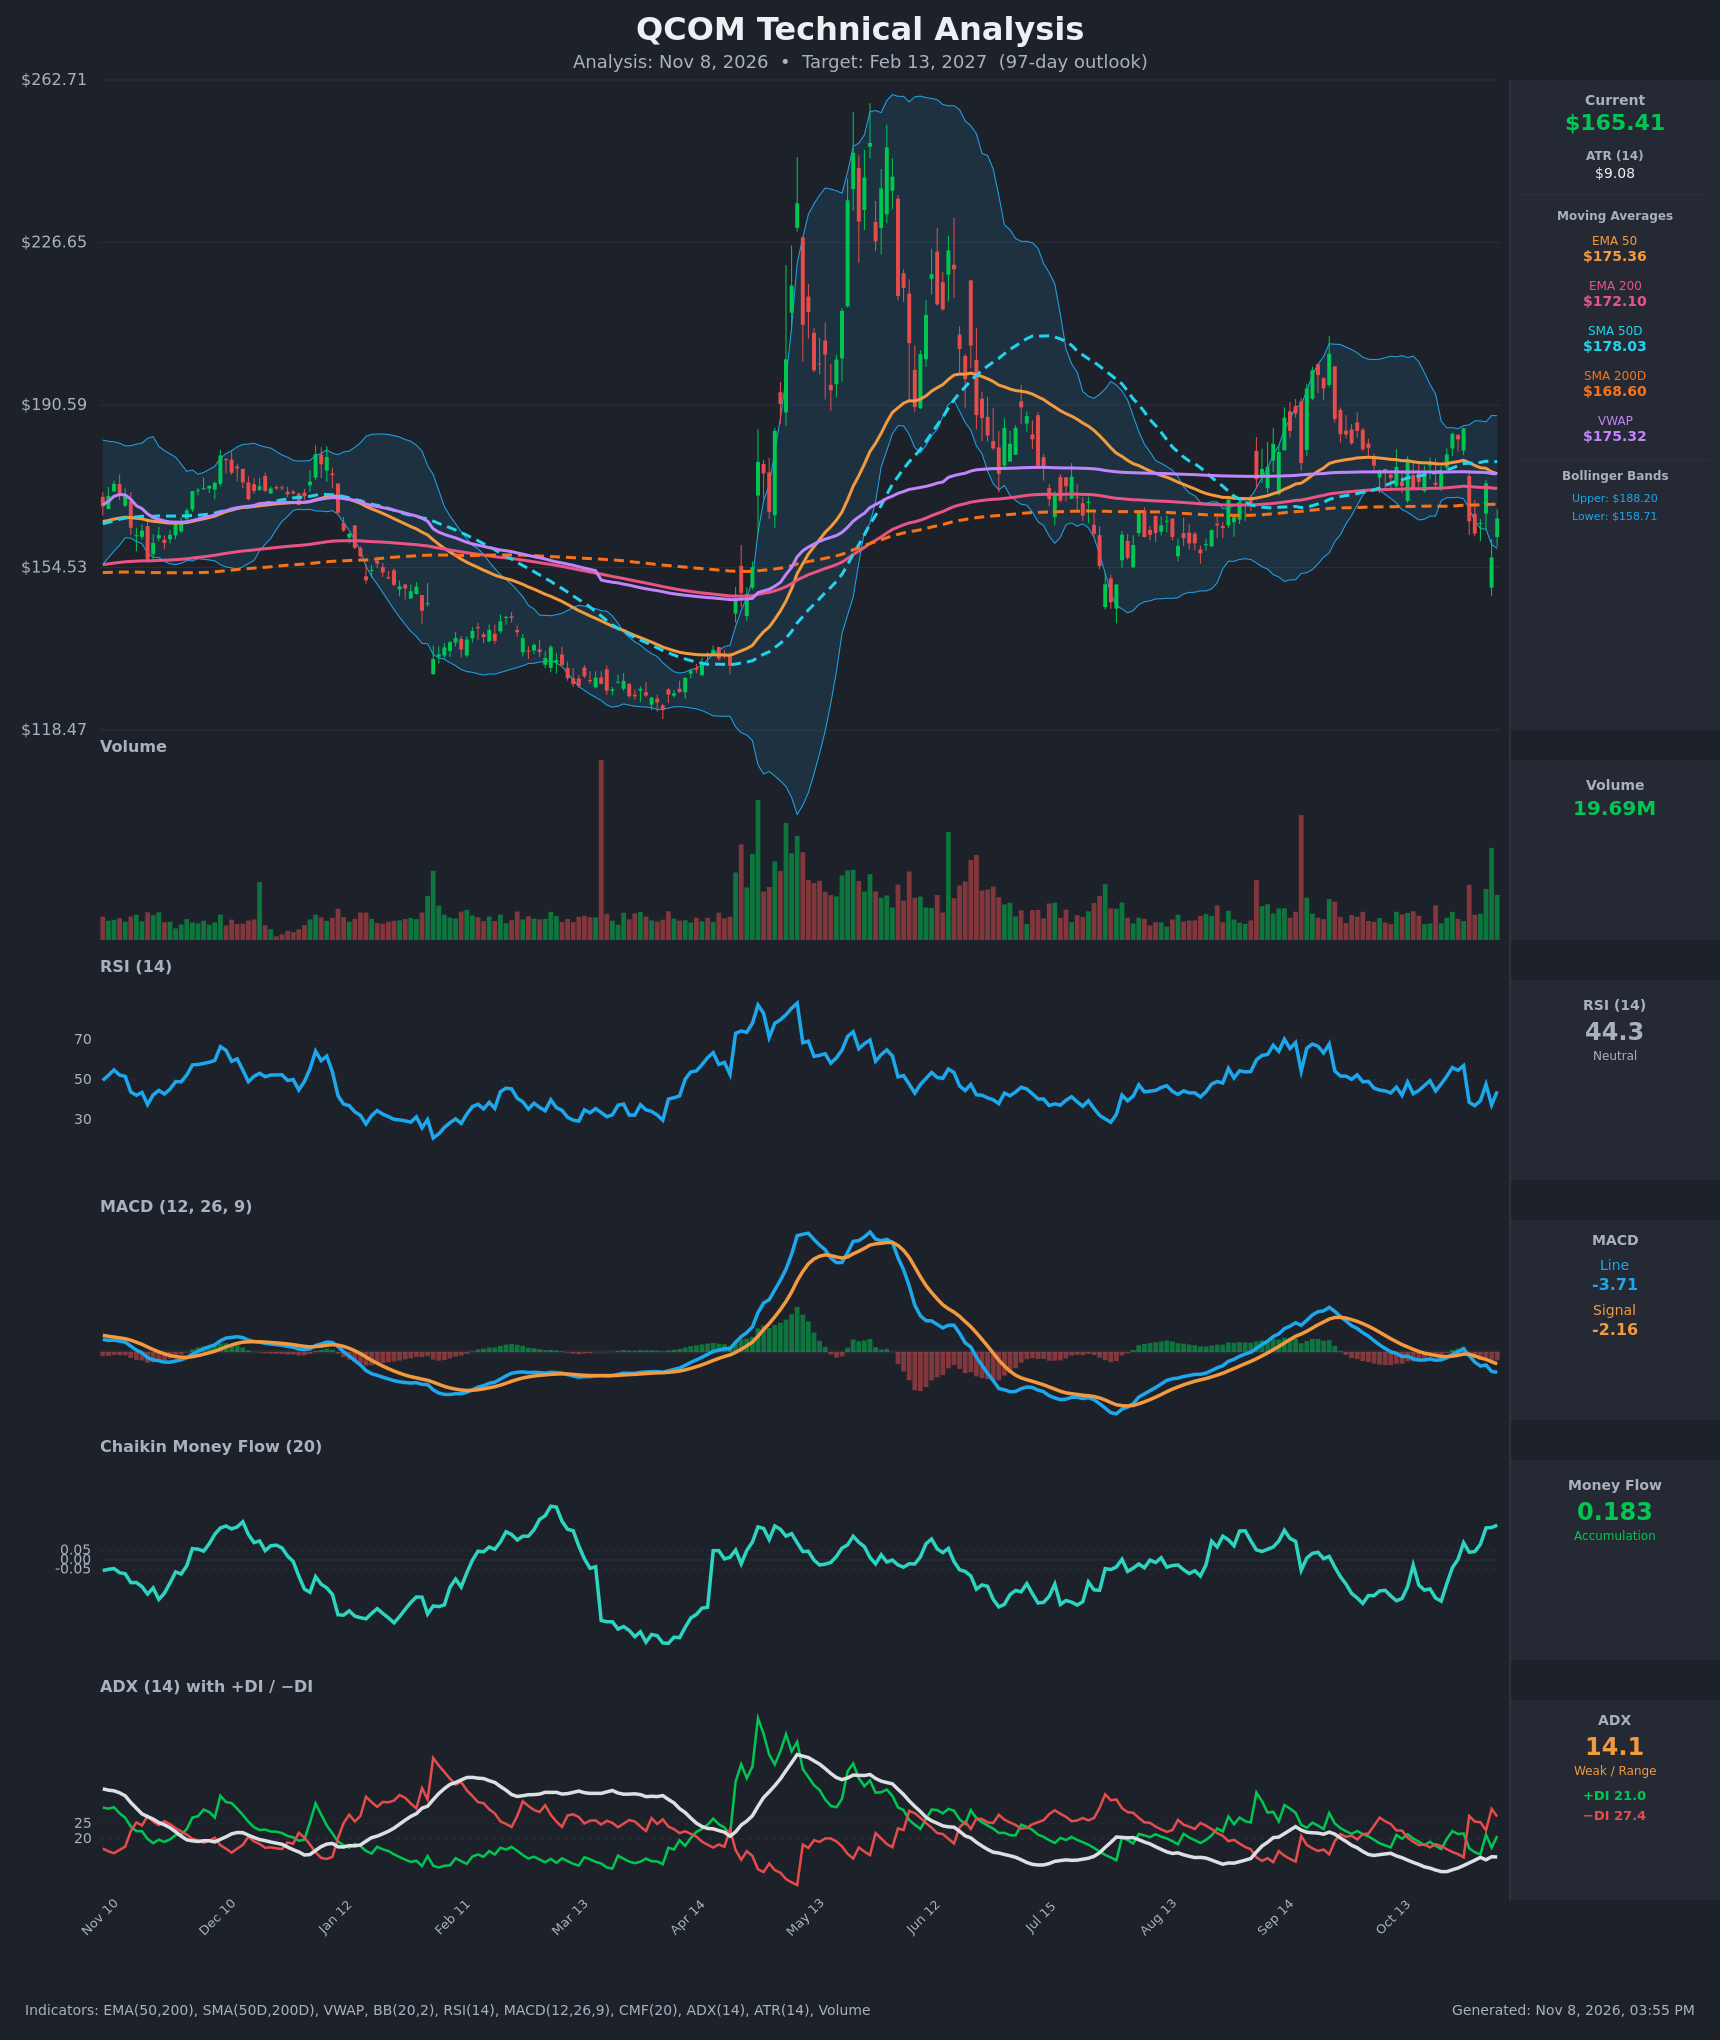
- RSI (14): 44.31, below the 50 midline but well off the 37.2–37.5 lows of Nov 2 and Nov 5. It is neither oversold nor overbought. Momentum is weak but attempting to stabilize after the earnings-gap drop from 57 to 37. [Neutral]
- 20 EMA: No 20 EMA value was supplied, so I use the EMA 50 at $175.36 and EMA 200 at $172.10. Price at $165.41 is below both, so they act as overhead resistance. EMA50 is falling, down from $178.32 on Oct 29, and is closing in on EMA200. [Bearish]
- MACD: Line -3.71 is below signal -2.16, and the gap widened from the Oct 30 crossover. Both lines are negative and the histogram is increasingly negative, which is bearish momentum with no sign of a turn yet. [Bearish]
- Bollinger Bands (20): Upper $188.20, lower $158.71, midline about $173.5. Price sits in the lower third, below the midline. The Nov 5 low of $156.75 pierced the lower band, and the bounce back inside suggests a short-term oversold reaction. The bands are wide from the gap volatility, which implies a large possible move. [Neutral]
- CMF (20): 0.183, well above +0.05, and rising from about 0.04 on Oct 30. Buyers have been absorbing the selloff, which is the main bullish counterweight in the data. [Accumulation]
- ADX (14): 14.1, below 20, so the trend is weak or range-bound. −DI (27.4) is above +DI (21.0), so sellers have the slight edge after the recent gap. ADX is only starting to tick up from its lows. [Weak Trend, Bearish lean]
- Volume: 19.69M on the latest bar, with a large green bar on the bounce, following heavy selling volume on the Oct 30 gap. Participation is elevated and two-sided: capitulation selling, then dip buying. [Neutral to slightly Bullish]
Other levels and crossovers:
- SMA50D is $178.03, SMA200D is $168.60 and VWAP is $175.32. Price is below all three.
- There is no death cross yet. SMA50D is still above SMA200D, and EMA50 is above EMA200, but the spread is narrowing.
DIVERGENCES & TRENDS
- CMF vs. price: CMF is rising to a multi-week high (0.183) while price made a lower low at $156.75. This is a bullish divergence in money flow and the main reason a rebound is possible.
- MACD and DI: MACD fell from +0.57 to -3.71 in six sessions. A bearish crossover on Oct 30 coincided with −DI surging above +DI (27.6 vs 17.0). The DI lines have narrowed slightly (21.0 vs 27.4), but −DI still leads.
- Price vs. MAs: The Oct 30 gap from $185.41 to $164.79 broke below EMA50, SMA50D, VWAP, EMA200 and SMA200D. The bounce to $173.19 on Nov 4 failed at the MAs, and the Nov 5 close at $156.75 was rejected from there. This is lower-high behavior, though the bounce back to $165.41 is constructive.
- RSI: It made a higher low (37.5 vs 37.2), which is a minor positive.
- ADX: At 14 it is very low, so the trend lacks conviction. Moves are likely to be choppy rather than directional.
- Larger picture: The stock is still in a wide $155–$185 area after the massive spike to about $260 and its full retracement. Rallies keep failing in the $175–$200 zone.
CHART PATTERNS
- Wide rectangle / range: Price has been boxed roughly between $155 (the Nov 5 low zone) and $185 (the Oct 27–29 highs). The breakdown from the upper part of the range resembles a failed breakout. This is similar to a Bearish Triple Top or Double Top at the range ceiling near $185. The pullback target is the range floor at about $156–$158. A close below it points to measured-move extension toward $140 (the Jul–Aug lows).
- Possible bearish pennant / flag: The tight bounce after the gap is consistent with a bearish flag or pennant. It is not confirmed, because it has only a few bars.
- Bullish counter-pattern: If $156.75 holds and price reclaims $175, a Double Bottom (Nov 2/Nov 5 lows) would target $185–$190.
- No clean, high-conviction pattern from the diagram is present. Treat these as probabilistic structures.
POTENTIAL SCENARIOS
- Scenario 1: Bearish Breakdown Below Range Floor — The failed rally, a bearish MACD and −DI dominance lead to a retest and break of the $156.75 low, with price drifting toward the Jul–Aug support. Trigger: daily close below $156.75, ideally on rising volume. Target: $145–$148, with an extension to $140. Invalidation: a daily close above $175.40 (EMA50/VWAP). (45% probability)
- Scenario 2: Neutral Range-Bound Chop — With ADX at 14, price oscillates between $156 and $175 as CMF accumulation offsets MACD weakness, ending the period near $162–$168. Trigger: failure to close beyond either $156.75 or $172. Target: $160–$168. Invalidation: a close above $175 or below $155 on volume. (25% probability)
- Scenario 3: Bullish Recovery — Accumulation (CMF 0.183) and the bullish money-flow divergence drive a reclaim of SMA200D and EMA200, then a fill of the earnings gap toward the range top. Trigger: a daily close above $172.10 with MACD turning up. Target: $180–$185. Invalidation: a close back below $158. (30% probability)
PRICE TARGETS
For the 97-day horizon (~Feb 13, 2027), the range width is about $41, or about 25% of the current price. This fits the 18–30% guidance for 61–180 days.
- Target Price: $159.00
- Expected Range: $140.00 to $181.00
- Key Levels: Support at $156.75, Resistance at $168.60
OVERALL BIAS
OVERALL BIAS: BEARISH - Price is below all key moving averages (EMA50/200, SMA50D/200D, VWAP). MACD is negative and still widening, and −DI leads +DI after the earnings gap. CMF accumulation and a possible range floor near $156 temper conviction, so the expected decline is modest.
This is educational analysis and not financial advice.